Remote sensing imagery is used by researchers at the University of Wisconsin–Madison to support recovery efforts after a tornado.
Defining the Problem
Following a tornado, first responders need maps of the width and location (swath) of the damage area. The biggest challenge when integrating remote sensing into disaster response is timeliness. To be most useful, remote sensing imagery maps must reach emergency management personnel within the first 100 hours after an event. These 100 hours are the most critical for response decisions. For example, first responders need to decide what houses, schools, hospitals, and nursing homes to search first for survivors. After this period, most of the important deployment decisions, such as where and how to get fire engines around blocked streets, have been made with or without the benefit of remote sensing imagery. After the response phase, emergency operations enter the recovery phase. This includes clean-up, victim support, and infrastructure repair. Here too, remote sensing imagery and maps are useful.
Selecting the Imagery
Researchers at the University of Wisconsin–Madison have developed techniques for using satellite imagery collected by the Landsat TM sensor and the ASTER sensor to measure and map the path of destruction left by tornados. Both sensors supply moderate-resolution imagery suitable for such damage analysis, including both before and after images to enable change detection. The type of imagery selected is determined by which sensor recorded the most recent, relatively cloud-free imagery before the storm, and by how soon after a storm a satellite with one of these sensors passes over a damaged area during relatively cloud-free conditions.
Applying the Imagery
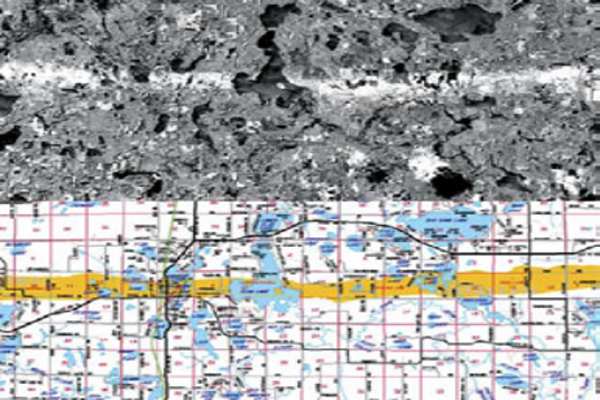
Researchers at the University of Wisconsin– Madison have worked with Wisconsin Emergency Management personnel to integrate satellite remote sensing imagery into the early response system for tornados. This integration has enabled disaster response personnel to use the imagery and resulting maps to support recovery efforts. The first use of remote sensing imagery in response to a tornado in Wisconsin occurred when an F3 tornado touched down in Siren, Wisconsin on June 18, 2001. The Landsat TM/ETM+ imagery acquired before and after the tornado clearly identified the affected area and was used to produce image and cartographic maps of the damage swath (Fig. 1). Landsat-7 captured imagery on May 18, 2001, one month before the storm and on June 19, 2001, the morning after the storm of June 18. The tornado tore across the landscape and left a 25-million dollar swath of destruction more than 40 kilometers long through a heavily forested area. This storm resulted in three deaths, eight serious injuries, complete destruction of 180 homes and businesses, and damage to 270 others. The University of Wisconsin–Madison team processed the Landsat imagery from both dates, calculated the change-detection data visible in the Landsat image map (Fig. 1), and quickly distributed the imagery and information to emergency management staff onsite via the Internet.
Figure 1: Image map (top) from Landsat TM/ETM+ imagery before and after an F3 tornado hit Siren, Wisconsin, on June 18, 2001. The damage swath is plotted on a cartographic map (bottom) that was used by disaster response personnel
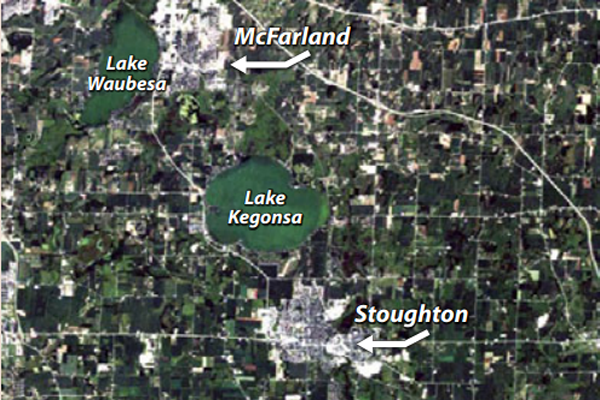
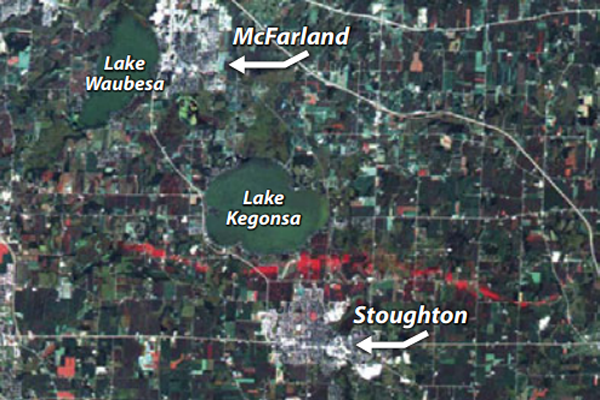
Four years later, this approach was also helpful when another F3 hit Stoughton, Wisconsin, on August 18, 2005. It was one of 28 tornados that ripped through southern Wisconsin that day . Fig. 2 is a Landsat TM image of the Stoughton area about one month before the August 18 tornado. Clouds interfered with the timing for acquiring a post-event Landsat image, but 10 days after the storm the ASTER sensor on the Terra satellite captured an image covering the damage area. Fig. 3 shows a change detection image that combines data from the earlier TM image with information from the post-tornado ASTER image. This change detection image highlighted the swath of the tornado very well. Even though cloud cover prevented researchers from producing damage swath maps within the first 100-hour response time, Wisconsin Emergency Management found the images helpful in recovery operations for weeks after the storm.
Figure 2 (top): Landsat TM imagery showing the Stoughton, Wisconsin area on July 19, 2005. This image uses blue, green, and red EM radiation bands in a natural color. Image Credit: Sam Batzli, University of Wisconsin–Madison
Figure 3 (bottom): Image shows the ground trace of the tornado. It uses the blue and green spectral bands of a Landsat 5 TM image acquired one month before the storm and the red band of a Terra ASTER image acquired 10 days after the storm.
Additional Information
Case study author: Sam Batzli (University of Wisconsin–Madison)
Case study from: Dodge, R.L and Congalton, R.G. 2013. Meeting Environmental Challenges with Remote Sensing Imagery, p. 32‐33. Published by the American Geosciences Institute Environmental Awareness Series. Click here to download the full handbook.

