Technology moves us closer to mapping and predicting deadly beach currents

What is a rip current?
Rip currents are fast, concentrated flows of water that can form on beaches that have breaking waves.1 Every beach is different, but rips generally form when waves break across a wide surf zone and the beach bathymetry is uneven (e.g., if there are sandbars, piers, jetties, or groynes along the beach).1 The conditions that create rip currents also make for great surfing; surfers use rips as a fast route through breaking waves, but if a swimmer is caught in one they can be quickly pulled out to deep water.
Worldwide, hundreds of people drown in rip currents each year. In Australia and the U.S., lifeguards rescue tens of thousands of people from rips every year, but there are still an average of 21 rip-related fatalities per year in Australia and 100 in the United States.2,3 In Costa Rica, an estimated 51 people drown in rips annually.4
The problem: challenges to mapping and predicting
Rip currents form when a beach has a certain combination of wave height, wave direction, and alongshore variation in bathymetry.2 Buoys have been tracking wave height and direction on many coastlines for several decades, but mapping the beach bathymetry has been challenging because on-site surveys are logistically difficult, time consuming, and expensive. Until recently, remote sensing instruments have not been able to see through the rough water of the surf zone.5
The idea: new mapping technology
Quick, easy, accurate, and highly localized identification of rip currents would allow authorities to better protect beachgoers from rip currents that form in different places over time as offshore sandbars change their shape, position, and size. The National Weather Service publishes regional risk forecasts in some areas,6 but these just account for wave height and direction and provide only a general guide to rip current risk. With technological advances, it may soon be possible to include bathymetric measurements in these forecasts, allowing predictions to be made for individual beaches rather than broader regions.

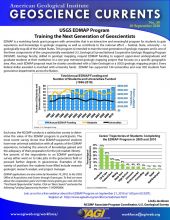
Lidar-based model of the variable beach morphology at Pensacola Beach, Florida. Colors indicate water depth, increasing from red to purple. Streak running directly seaward from the beach is the pier. Image Credit: S. Trimble (image data from DigitalGlobe, Lidar from NOAA)
Three main techniques can be used to measure a beach’s bathymetry:
- Radar (since the late 1990s8): an x-band radar mounted above the water on any structure, or on a vehicle driving along the coast,9 can be used to “film” the water surface in high resolution, capturing how waves change, warp, and break. This can be combined with offshore measurements of wave height and length to calculate the bathymetry below the surface that produced the observed wave changes, revealing locations of sandbars but not the depth of the water column.9
- Lidar (widely available since the late 1990s10): stands for light detection and ranging. A laser pulse measures the distance from the instrument to a surface, such as the seabed, to generate a 3D elevation map of that surface. Advances in data processing and the use of green laser pulses that can pass through shallow water have increased the accuracy of these methods in coastal zones to ± 0.5 feet.10 Although traditionally collected by manned aircraft, costs will continue to fall as drone-mounted lidar becomes more common.
- Satellites (since 2000): the amount of blue and green light reflected back to a satellite by a body of water is related to the water depth. Satellite measurements taken across an area can be used to produce a bathymetric map. This method is increasingly accessible as high-quality commercial satellites become more abundant and affordable. The DigitalGlobe WorldView satellites currently photograph most locations once a day with a resolution of 1 foot (0.31 meters) in black and white imagery, and 4 feet (1.2 meters) in the color range used to calculate water column depth. This method cannot be used everywhere since it requires very clear waters free from heavy turbulence or suspended sediment, but it is currently much cheaper than radar and lidar methods, although less accurate (± 2 to 4 feet).11 Regardless of how the bathymetry is measured and modeled, as long as available data have a resolution of 6.6 by 6.6 feet (2 by 2 meters) or better, it is possible to detect rip-prone channels, which are narrow, long, and run directly away from the shore.12
Toward the future: Automated detection becomes possible
Many beach authorities currently warn people about rips with a combination of informative signs, flags to indicate potentially unsafe conditions, and lifeguards. However, many beachgoers do not know what the signs and flags mean, how to identify dangerous rips, or how to escape if they are caught in a rip.7 Improved real-time or daily detection of rip currents could be used in the near future to better warn the public with more specific forecasts and distinct “keep out of the water” signs where and when rip channels are detected. Improved accuracy, lower costs, and automated detection may make these technologies viable for beach safety efforts on local, state, and national scales.
At a glance
The issue
- Dangerous rip currents can form on most beaches with breaking waves
- Rip currents can vary in location, strength, and appearance, making it difficult to warn beachgoers
Why it matters
- Swimmers can be quickly pulled away from shore by rips
- Most people do not know how to identify rip currents and/or are unsure how to escape them7
The idea
- New technologies are improving our ability to map a beach’s bathymetry, which is key to whether or not rips can form
- Combining bathymetric maps with wave data, which is already monitored by offshore buoys, can allow scientists to identify where rips may occur
Toward the future
- As these technologies become more affordable, local authorities could use them to make daily bathymetric maps and highly specific rip current forecasts
Key concepts, defined
Bathymetry: underwater land surface topography or landscape shape
Learn More
National Weather Service - Rip currents
Science of the Surf
North Carolina State University – What is LIDAR Beach Mapping?
NASA – LIDAR in the Wake of the Storm
Many satellite images (typically 6 months or older) can be freely downloaded from USGS or NOAA websites, but users may need GIS software to view and use them. NOAA provides many up-to-date weather data for free download in excel and csv formats:
USGS satellite imagery
NOAA imagery and other data
NOAA buoy data
NOAA weather station data
References:
1 Castelle B, Scott T, Brander RW, and McCarroll RJ (2016). Rip current types, circulation and hazard. Earth-Science Reviews, 163:1-21.
2 Short AD and Hogan CL (1994). Rip currents and beach hazards: their impact on public safety and implications for coastal management. Journal of Coastal Research, SI12:197-209
3 United States Lifesaving Association (2018). Rip Currents (accessed 03 August 2018).
4 Arozarena I, Houser C, Gutierrez-Echeverria A, and Brannstrom C (2015). The rip current hazard in Costa Rica. Natural Hazards, 77(2):753-768.
5 Brander RW and Cowell PJ (2003). A trend‐surface technique for discrimination of surf‐zone morphology: rip current channels. Earth Surface Processes and Landforms, 28(8):905-918.
6 National Weather Service (2017). Surf Zone Forecasts. (accessed 3 August 2018)
7 Brannstrom C, Trimble S, Santos A, Brown HL, and Houser C (2014). Perception of the rip current hazard on Galveston Island and North Padre Island, Texas, USA. Natural Hazards, 72(2):1123-1138.
8 Bell PS (1999). Shallow water bathymetry derived from an analysis of X-band marine radar images of waves. Coastal Engineering, 37(3):513-527.
9 McNinch JE (2007). Bar and swash imaging radar (BASIR): a mobile X-band radar designed for mapping nearshore sand bars and swash-defined shorelines over large distances. Journal of Coastal Research, 23(1):59-74.
10 Irish JL, McClung JK, and Lillycrop WJ (2016). Airborne lidar bathymetry: the SHOALS system. US Army Engineer District-Mobile. Mobile, AL, United States.
11 Lee KR, Kim AM, Olsen RC, and Kruse FA (2011). Using WorldView-2 to determine bottom-type and bathymetry. Proc. SPIE 8030, Ocean Sensing and Monitoring III, 80300D (5 May 2011).
12 Trimble SM, Houser C, and Bishop MP (2017). Degree of anisotropy as an automated indicator of rip channels in high resolution bathymetric models. In AGU Fall Meeting Abstracts, 2017.


")

