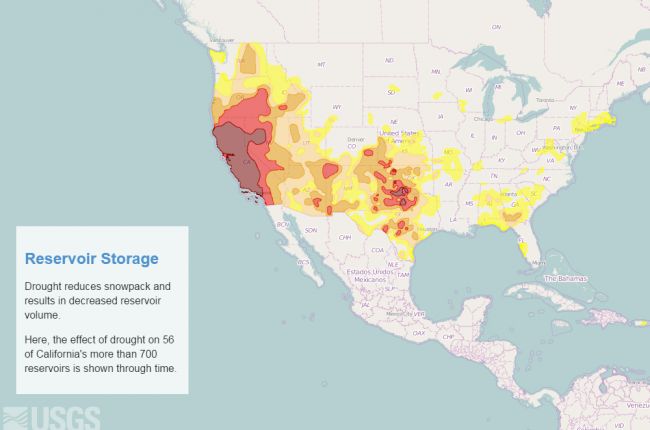
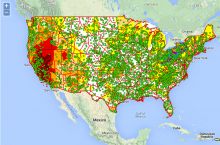
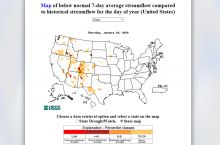
The U.S. Geological Survey provides a website of visualizations that show how California's extreme drought in the early-mid 2010s progressed through the early-mid part of the decade and then was relieved with significant rain and snowfall in 2016-2017. Visualizations of the extent and severity of drought, change in reservoir volumes, and streamflow compared to historic rates are all available on the website, which you scroll through to see different features.
Click here to see the visualization of California's drought

