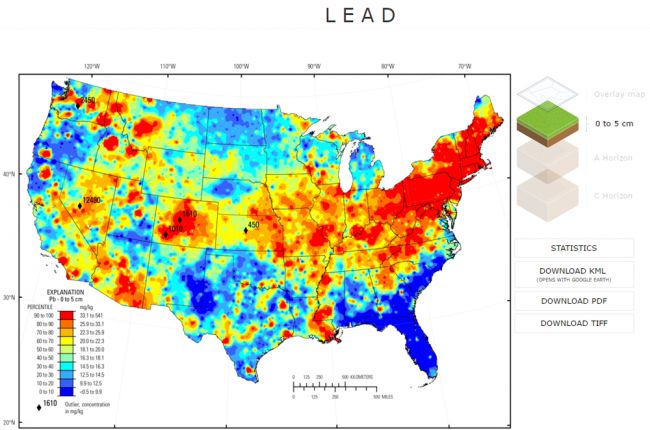
The U.S. Geological Survey provides geochemical and mineralogical maps for the conterminous United States, based on sampling data with a spatial resolution of 1 sample per 1,600 square km, for a total of 4857 sites across the country. The resulting interactive maps allow users to see regional variations in soil chemistry at different depths in the soil.
The example map shown above gives the measured concentrations of lead in the topmost 5 cm of soils across the country. Users can view maps at three different levels in the soil for 45 different chemical elements, and at two different levels for soil mineralogy.
Additional datasets that can be overlain on these maps include average annual precipitation, geology, and glacial boundaries, so that users can see the influences of each on the resulting soil chemistry. Full maps and statistical summaries can be found in an accompanying report, published in 2014. The raw dataset can be found in an additional report, published in 2013.
Click here to access the USGS geochemical and mineralogical maps.
Source: U.S. Geological Survey

