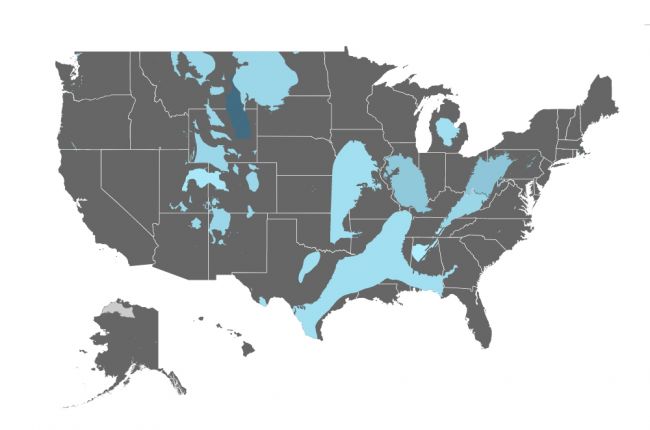
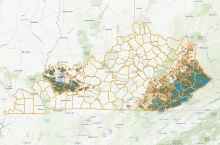
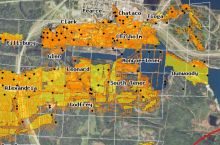
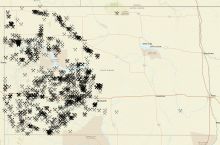
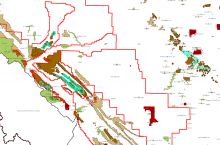
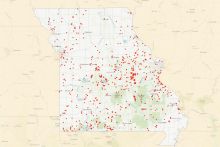
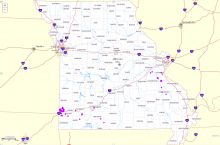
The U.S. Energy Information Administration’s Coal Data Browser provides a variety of state-specific and nationwide visualizations for their coal reports and data sets.
The annual data sets go back to 2008 and can be displayed as a time series graph, bar graph, U.S. map, or coal basin map. Data set categories and sub-categories include:
- Coal mine production
- Labor hours Productivity
- Average number of employees
- Mine level data
- Shipments of coal to the electric power sector
- Price
- Quantity
- Heat content
- Ash content
- Sulfur content
- By mine/plant
- Imports and exports of coal
- Coal consumption and quality
- Price
- Receipts
- Stocks
The Coal Data Browser also has visualizations for pre-generated annual and quarterly reports on topics such as region-specific coal productivity and country-specific coal exports.
Each visualization can run an animation that displays the changes in the data over time.
All data sets and reports can be downloaded for further use and analysis.
Click here to access the interactive visualization tool.
Source: U.S. Energy Information Administration

