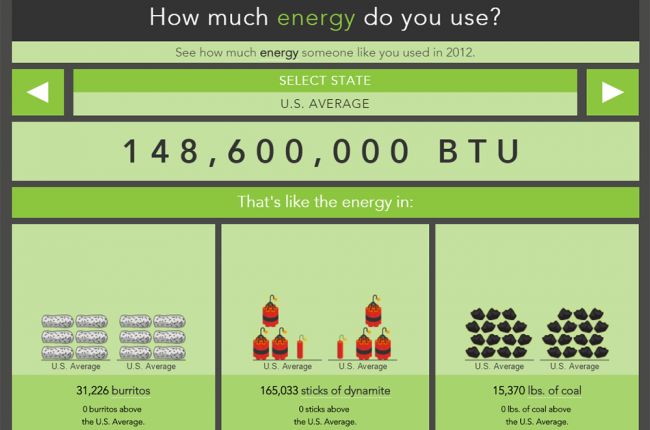
The U.S. Department of Energy's visualization of per person energy use allows you to explore what the average energy usage for your state looks like in the form of burritos, dynamite, and other more relatable metrics. Because most people can't visualize what it means to use 148,600,000 BTU, this visualization is particularly useful for putting personal energy usage into perspective.
The data for this visualization come from the EIA State Energy Data System and represent 2012 energy use.
Click here to view the full energy use visualization.
Source: U.S. Department of Energy

