Geologic maps are useful in identifying areas that may be affected by post-wildfire debris flows. Land-use planners use these maps to identify potential hazards in areas that are proposed for development and to develop mitigation strategies. The maps can also focus post-wildfire emergency planning on the areas with the highest likelihood of debris flows. It is cheaper to avoid or mitigate problems than to repair damage.
Defining the Problem
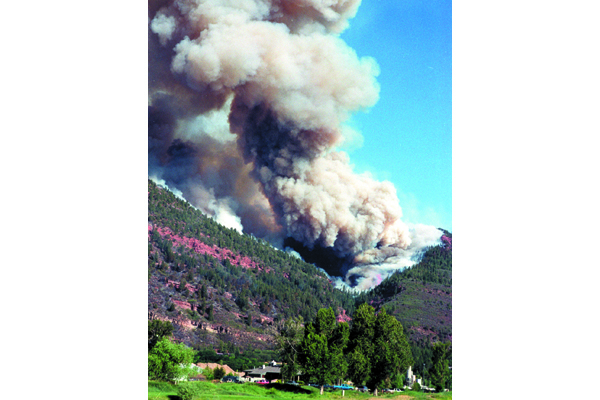
Wildfires, such as the Missionary Ridge fire that burned for more than a month in 2002 near Durango, Colorado (Fig. 1), and their aftermath can cause subsequent property and environmental damage. Many areas denuded by the fire are now susceptible to rapid erosion during heavy precipitation with resulting debris flows, or mudslides.
Figure 1: Homeowners and emergency managers are still coping with debris flows and the aftermath of the 2002 Missionary Ridge wildfire near Durango, Colorado. Credit: P. Winkworth
The Geologic Map
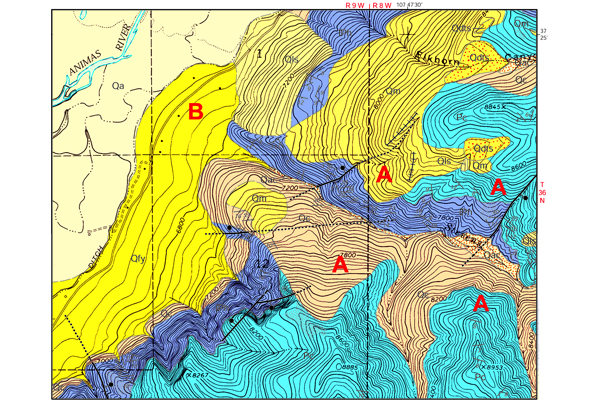
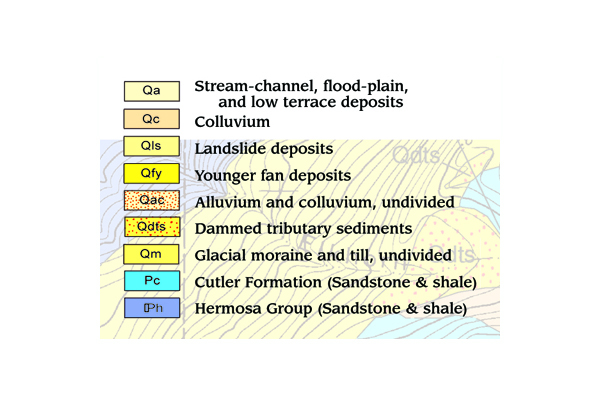
Geologic maps are tools for evaluating post-fire, debris-flow hazards. The geologic map (Fig. 2)1 shows the distribution of rock types and surface deposits in relation to topography. The darker yellow pattern (Qfy) shows the location of alluvial fans created by historic debris flows. The areas most susceptible to post-fire erosion are the glacial moraine (Qm, A), colluvium (Qc, A), and Cutler Formation (Pc, A).
Figure 2: This part of the Hermosa geologic quadrangle map covers the burn area around Stevens Creek. The darker yellow pattern (Qfy) shows debris fans mapped in 2001. Credit: Colorado Geological Survey
Applying the Geologic Map
The Missionary Ridge fire illustrates how geologic maps can be used to assess and predict natural hazards. Although this 73,000-acre fire was extinguished in July 2002, emergency managers are still planning for, and coping with, post-fire debris flows. Digital mapping capabilities produced color copies of the geologic map soon after the fire for researchers and emergency response teams to use in identifying high-risk debris-flow areas. The digital map also could be added as a layer in a user’s GIS database.
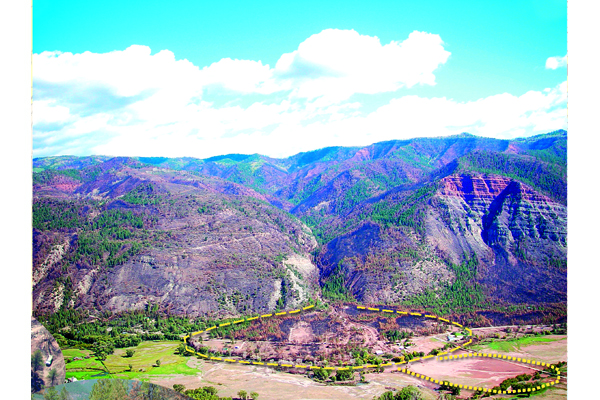
Mapping in 2002 shortly after the fire revealed a sequence of older debris flows exposed in the incised channel of a modern, fire-induced debris flow that formed after the Missionary Ridge fire (Fig. 3). Associated charcoal layers dated by C14 methods showed a record of repeated fire followed by debris flows extending back 4300 years. The cycles of major fires in the Durango area correlated well with a fire sequence established in Yellowstone National Park, hinting at a broader geographic extent of repeated wildfires and debris flow events.
Figure 3: Aerial view looking up Stevens Creek at burn area of the 2002 Missionary Ridge wildfire and the debris fan at the mouth of the creek. After the fire a house on the historic debris fan was engulfed by a debris flow Credit: San Juan Civil Air Patrol
Conclusion
Geologic maps are useful in identifying areas that may be affected by post-wildfire debris flows. Land-use planners use these maps to identify potential hazards in areas that are proposed for development and to develop mitigation strategies. The maps can also focus post-wildfire emergency planning on the areas with the highest likelihood of debris flows. It is cheaper to avoid or mitigate problems than to repair damage.
References
1Geologic Map of the Hermosa 7.5’ quadrangle (Colorado Geological Survey Open File Report 02-1)
Additional Information
Case study authors: Vince Matthews (Colorado Geological Survey) and David Gonzales (Fort Lewis College)
Case study from: Thomas, W.A. 2004. Meeting Challenges with Geologic Maps, p. 44-45. Published by the American Geosciences Institute Environmental Awareness Series. Click here to download the full handbook.

