The geologic and groundwater mapping products support county land use and planning decisions in this rapidly developing area. State water agencies, planners, developers, home owners, home buyers, real estate agents, and county officials use the maps to support an array of decisions regarding water rights, lot size, well placement, water system design, and other land use decisions. Similar applications of geologic maps are being used throughout New Mexico.
Defining the Problem
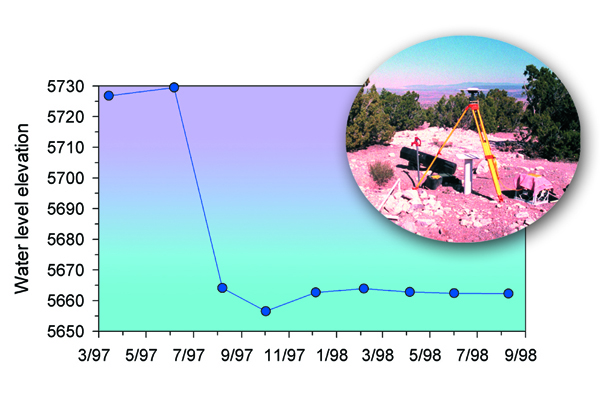
The population of the historic village of Placitas, New Mexico, in the picturesque and geologically complex Sandia foothills north of Albuquerque, has tripled since 1970. Increased domestic well development, combined with persistent droughts, have culminated in dry and depleted wells (Fig. 1), reduced discharge from perennial springs, reduced property values, and a growing awareness of the potential for aquifer depletion.
Figure 1: A groundwater hydrograph from a domestic well completed in an isolated sandstone of the Cretaceous lower Mancos Shale. The water level dropped about 70 ft in one year and the well subsequently went dry. Credit: P. Johnson
The Geologic Map
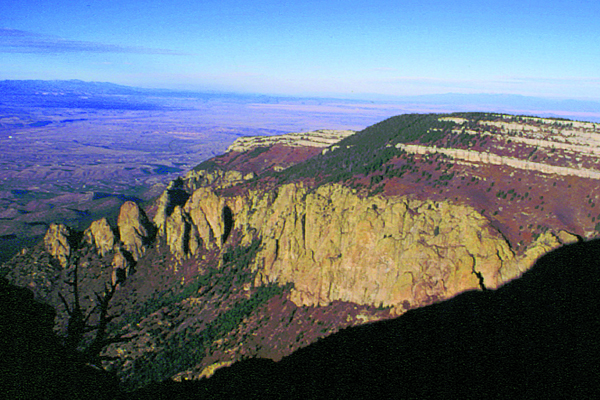
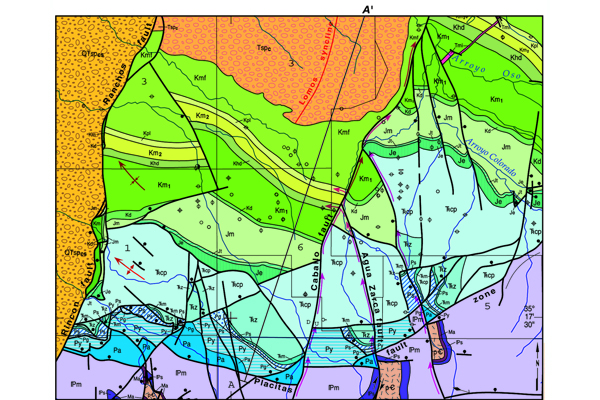
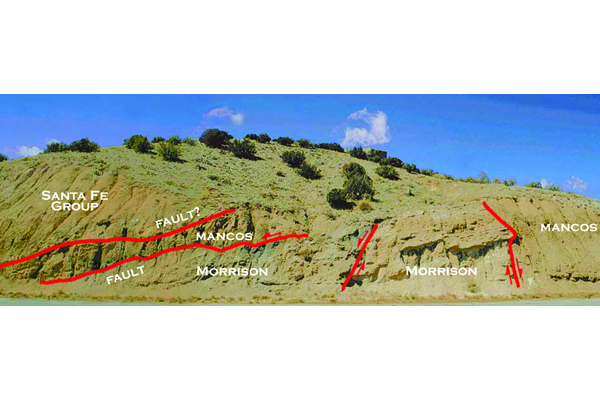
The Placitas area straddles the geologic boundary between the Sandia Mountains and the Albuquerque Basin of the Rio Grande rift (Fig. 2). The availability of potable groundwater is highly variable and controlled entirely by the complicated geology of the region. The geologic map (Fig. 3) enables us to better understand these controls and the complexity of this tectonically dynamic region. The geologic units exposed in Placitas vary from Precambrian granite and gneiss to Paleozoic limestone and sandstone, a variety of fine-grained Mesozoic sedimentary rocks, and Cenozoic alluvium composed of 23.7-million- to 700,000-year-old Santa Fe Group basin fill. Major faults in the region, including the complex Placitas fault zone, dissect the Paleozoic and Mesozoic strata (Fig. 4).
Figure 2 (top): The Sandia Mountains, looking north along the crest into the Albuquerque Basin. Credit: A. Read
Figure 3 (middle): A portion of the geologic map of the Placitas area shows that major faults and structures have disrupted the largely sedimentary formations. Red arrows mark the preferential groundwater flow pathways. Credit: New Mexico Bureau of Geology and MinerFig. 3. A portion of the geologic map of the Placitas area shows that major faults and structures have disrupted the largely sedimentary formations. Red arrows mark the preferential groundwater flow pathways. Credit: NMBGMR
Figure 4 (bottom): This road cut shows the Ranchos fault zone west of Placitas, where older Mesozoic strata (Mancos and Morrison formations) are faulted against younger Santa Fe Group basin fill. Credit: L. PriceFig. 4. This road cut shows the Ranchos fault zone west of Placitas, where older Mesozoic strata (Mancos and Morrison formations) are faulted against younger Santa Fe Group basin fill. Credit: L. Price
Applying the Geologic Map
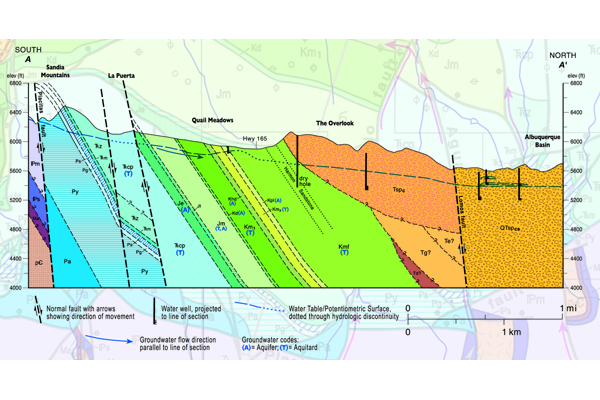
In this region, faults and stratigraphic barriers compartmentalize groundwater into small isolated bedrock aquifers, control the movement of mountain recharge, and affect water potability and availability. Digital geologic maps provided the geologic framework for a three-year hydrogeologic study of this maze of aquifers and aquitards (confining beds). When combined with subsurface geologic information from water well records, the maps provided a basis for locating water-level monitoring and water-quality sampling networks. By synthesizing these data, the study was able to delineate the locations of aquifers, aquitards, hydrologic boundaries, and preferential flow pathways (Figs. 5).
Figure 5: This geologic cross section through the Paleozoic and Mesozoic strata in Placitas, NM, shows sub-vertical strip aquifers (A) layered between aquitards (T). Aquitards are the less-permeable rock layers confining the aquifers. Credit: NMBGMR
Conclusion
The geologic and groundwater mapping products support county land use and planning decisions in this rapidly developing area. State water agencies, planners, developers, home owners, home buyers, real estate agents, and county officials use the maps to support an array of decisions regarding water rights, lot size, well placement, water system design, and other land use decisions. Similar applications of geologic maps are being used throughout New Mexico.
Additional Information
Case study author: Peggy S. Johnson (New Mexico Bureau of Geology and Mineral Resources)
Case study from: Thomas, W.A. 2004. Meeting Challenges with Geologic Maps, p. 58-59. Published by the American Geosciences Institute Environmental Awareness Series. Click here to download the full handbook.

