
Geoscience Currents
Search our archive of Geoscience Currents. For the most recent data about the geoscience profession, please visit our Latest Data page.
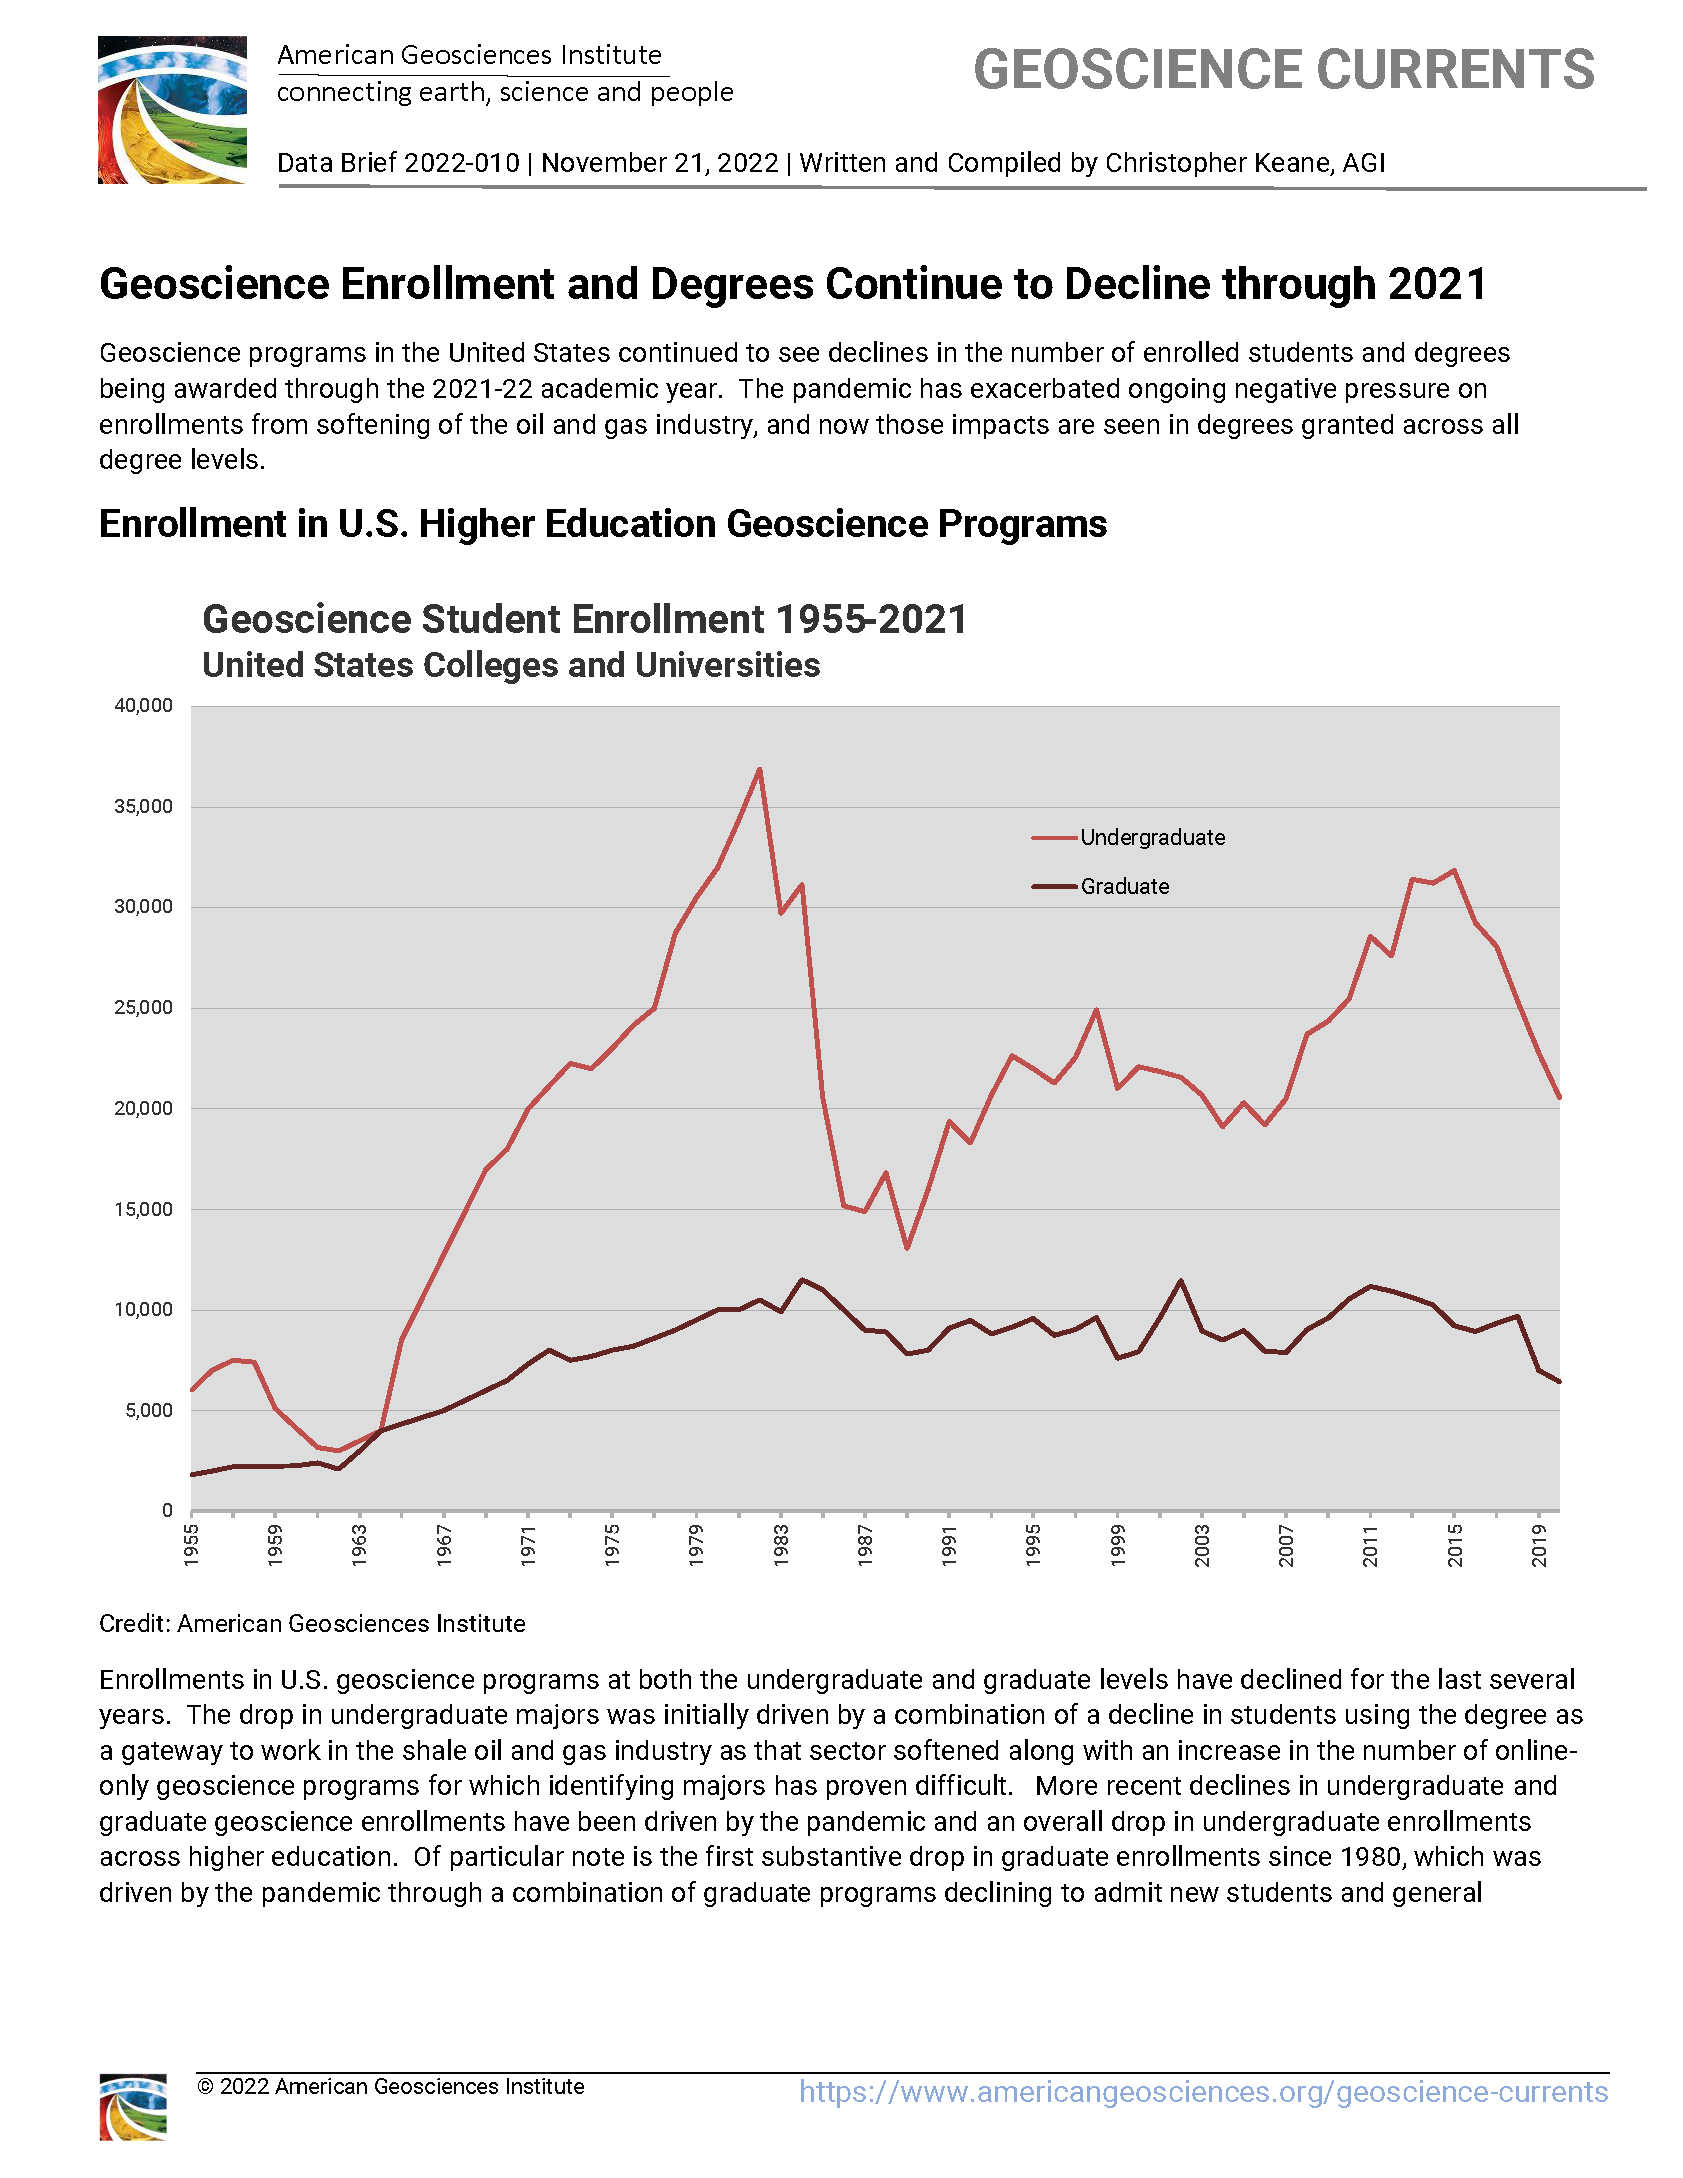
U.S. Geoscience Enrollments and Degrees through 2021
Geoscience programs in the United States continued to see declines in the number of enrolled students and degrees being awarded through the 2021-22 academic year. The pandemic has exacerbated ongoing negative pressure on enrollments from softening of the oil and gas industry, and now those impacts are seen in degrees granted across all degree levels.
Date: 2022-11-21 | ID: DB_2022-010
Download PDF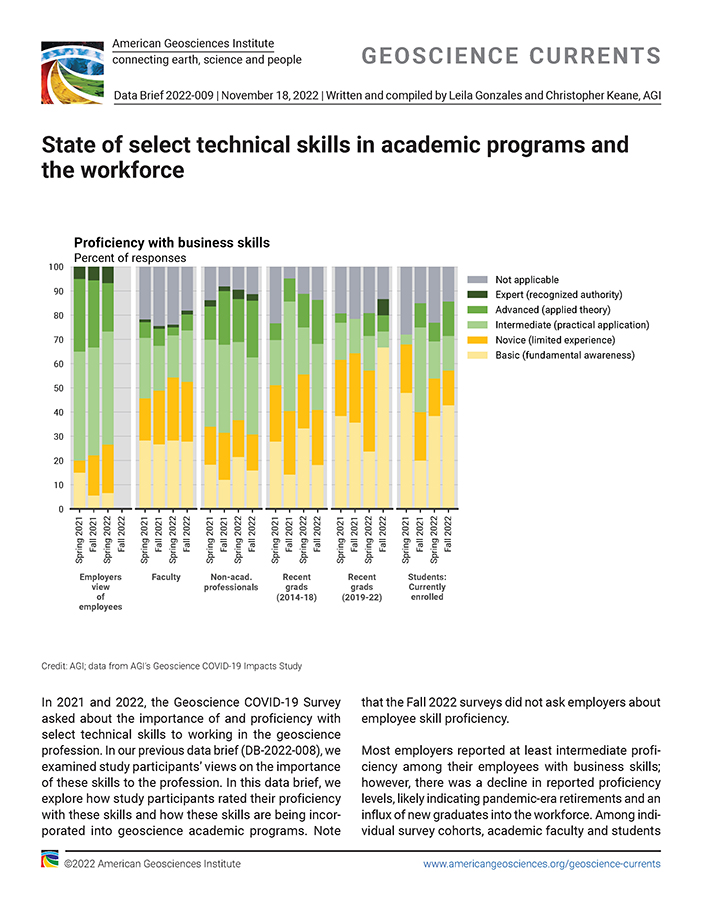
State of select technical skills in academic programs and the workforce
The Geoscience COVID-19 Survey found that employers reported varying levels of proficiency among their employees with select technical skills, including business, database management, graphic design, data visualization, and programming. Academic faculty and students showed similar levels of proficiency with some skills, while non-academic professionals demonstrated higher proficiency in others. The incorporation of these skills into academic programs varied by skillset, with some departments reporting a decline in teaching certain skills, such as data visualization.
Date: 2022-11-18 | ID: DB_2022-009
Download PDF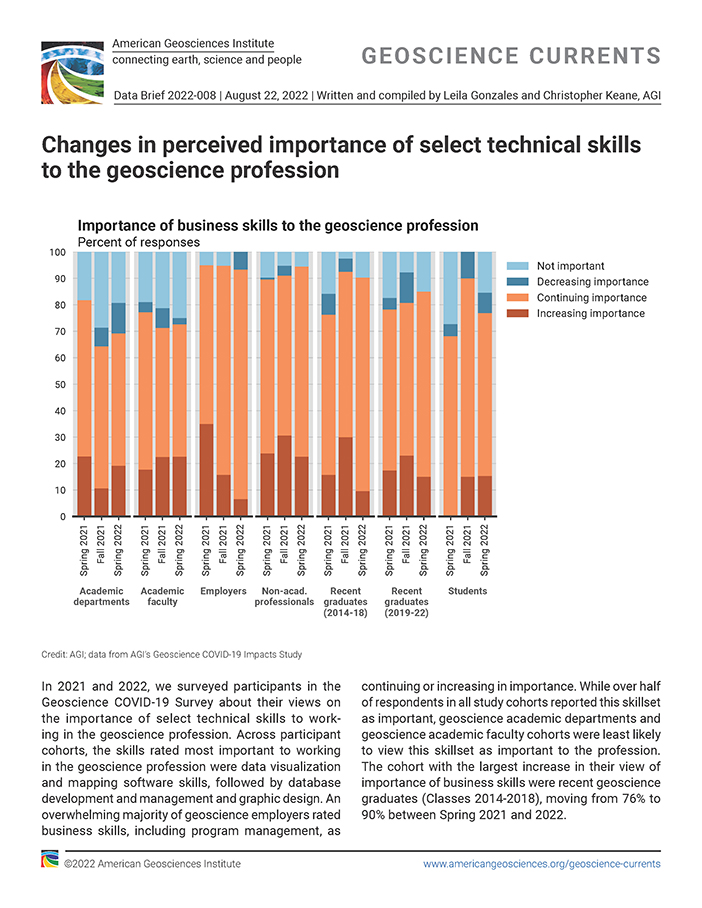
Changes in perceived importance of select technical skills to the geoscience profession
Results from our 2021 and 2022 Geoscience COVID-19 Surveys revealed that technical skills such as data visualization and mapping, database management, and graphic design were considered increasingly important across geoscience cohorts. Business skills, particularly program management, were also emphasized by geoscience employers and recent graduates. Emerging skills like machine learning, AI, and programming were increasingly valued, especially by students and recent graduates, although academic departments were less likely to view these skillsets as critical to the profession.
Date: 2022-08-22 | ID: DB_2022-008
Download PDF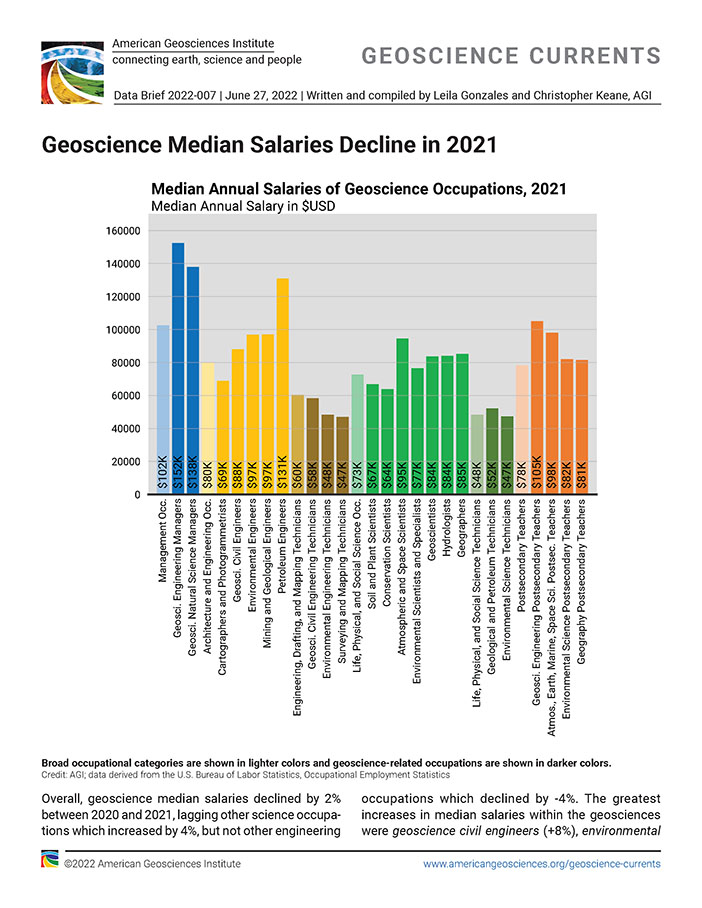
Geoscience Median Salaries Decline in 2021
Overall, geoscience median salaries declined by 2% between 2020 and 2021, lagging other science occupations which increased by 4%, but not other engineering occupations which declined by 4%. The greatest increases in median salaries within the geosciences were geoscience civil engineers, environmental engineers, and mining and geological engineers. The largest declines in salaries were for geoscientists, environmental engineering technicians, and atmospheric and space scientists.
Date: 2022-06-27 | ID: DB_2022-007
Download PDF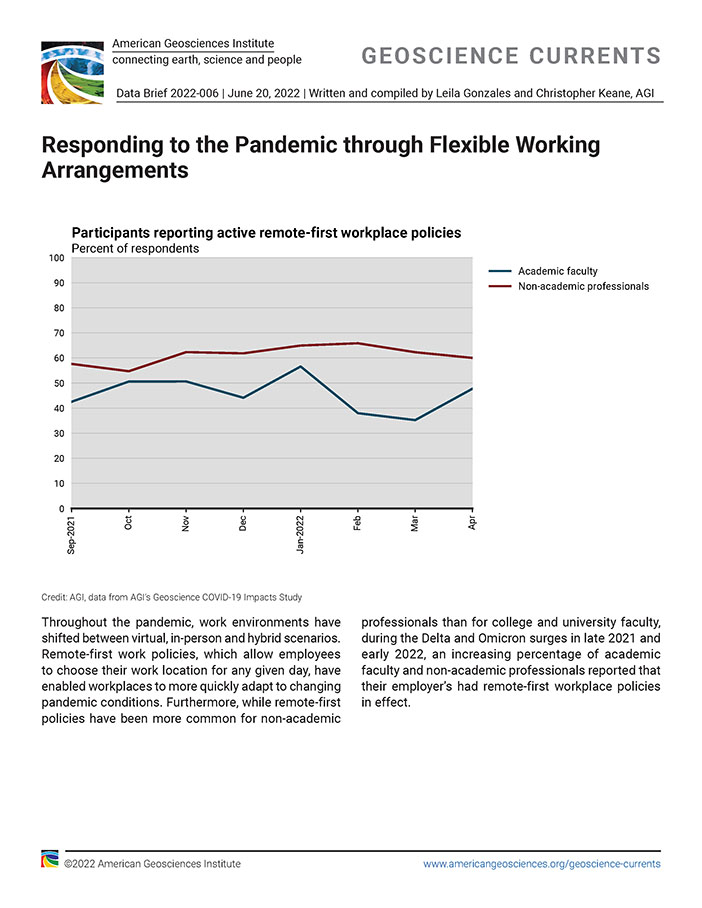
Responding to the Pandemic through Flexible Working Arrangements
During the pandemic, work environments shifted between virtual, in-person, and hybrid scenarios, with remote-first policies becoming more common. Academic faculty transitioned away from remote work as a primary environment starting in Fall 2021, while non-academic professionals returned to in-office work shortly after vaccine roll-out in early 2021. Remote work remains a prominent option for both groups, however, with academic faculty working remotely less often than non-academic professionals.
Date: 2022-06-17 | ID: DB_2022-006
Download PDF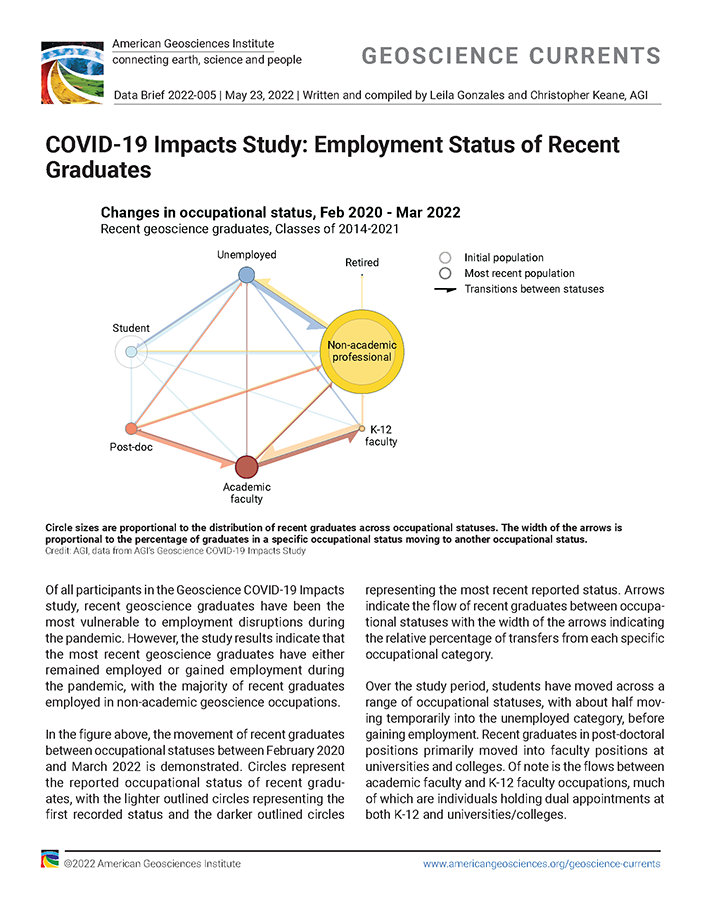
COVID-19 Impacts Study: Employment Status of Recent Graduates
Recent geoscience graduates faced employment disruptions during the pandemic but remained employed or gained employment in non-academic occupations. Those who earned their degrees between 2014 and 2018 had the most stable employment situation. Employment rates among recent graduates have increased since 2020, with peaks in unemployment coinciding with economic shutdowns and summer graduations.
Date: 2022-05-23 | ID: DB_2022-005
Download PDF
Pandemic Impacts to Instructional Formats through March 2022
The COVID-19 pandemic led to rapid shifts in instructional modes for geoscience courses, labs, and field activities, with many departments initially adopting virtual or hybrid formats but returning to predominantly in-person instruction as mask mandates eased. By March 2022, over half of departments reported resuming only in-person instruction for lecture courses, while most lab sections and field activities were also conducted in a single format. The integration of virtual instructional modes declined substantially during the pandemic, with a brief uptick in early 2022 but overall remaining at around 40% for courses by March 2022.
Date: 2022-05-06 | ID: DB_2022-004
Download PDF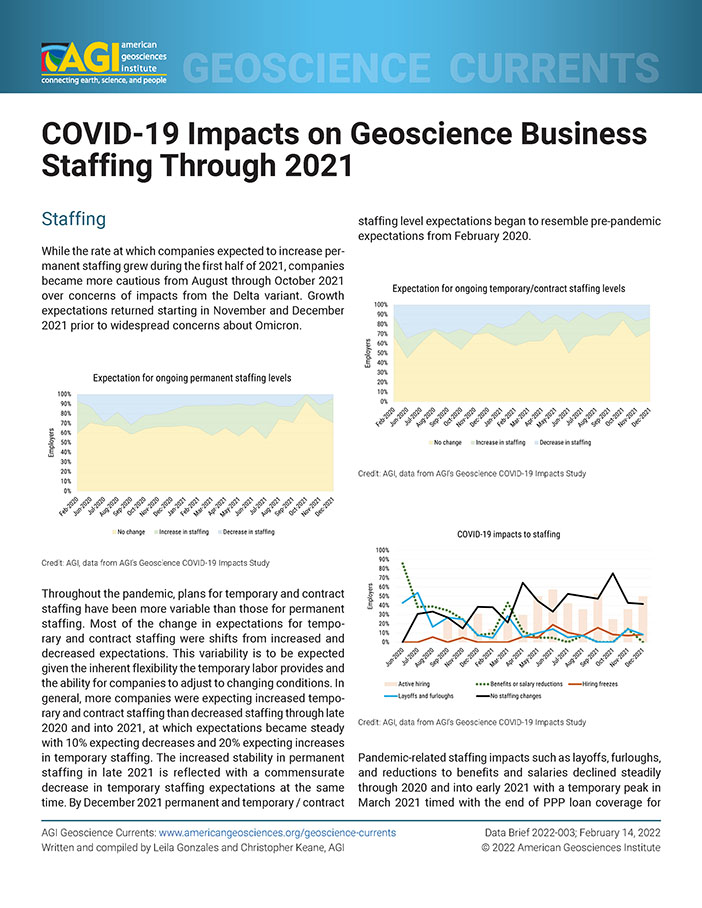
COVID-19 Impacts on Geoscience Business Staffing Through 2021
In 2021, employers' staffing expectations fluctuated, with interest in hiring rising early in the year, fading by August due to Delta variant concerns, and rebounding in November before Omicron surfaced. By year-end, most employers had lifted travel and fieldwork restrictions and adopted flexible remote and in-office policies. Recruitment challenges diminished by mid-year, with employers seeking hires skilled in project management, data visualization, mapping software, and database management, while noting improved employee proficiency in virtual platforms, data visualization, and complementary technical skills, though virtual collaboration remained a challenge.
Date: 2022-02-14 | ID: DB_2022-003
Download PDF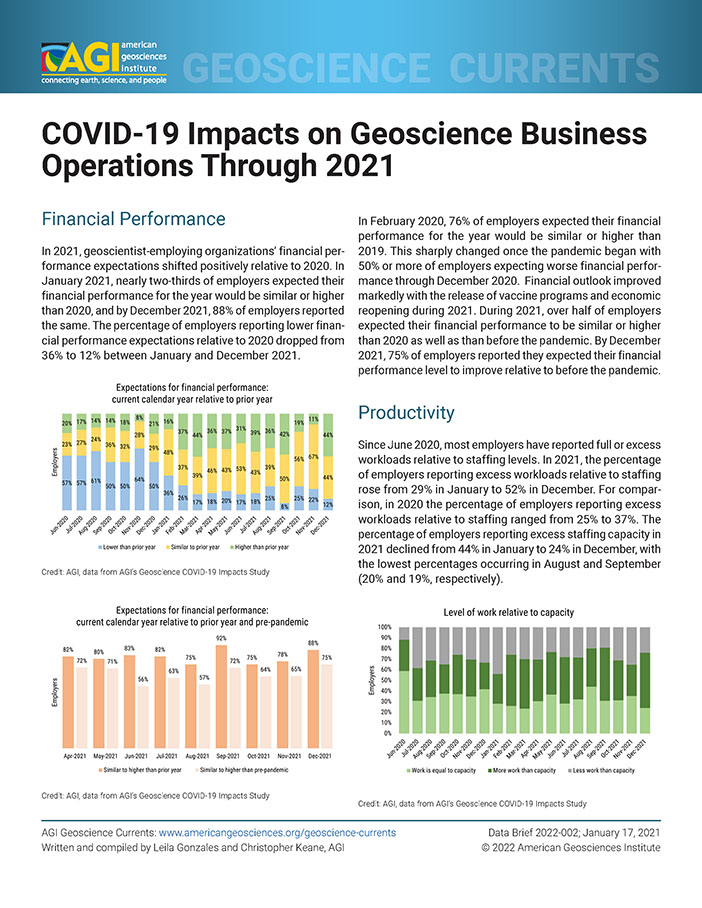
COVID-19 Impacts on Geoscience Business Operations Through 2021
In 2021, financial performance expectations for geoscientist-employing organizations improved compared to 2020, with most reporting full or excess workloads and minimal pandemic-related impacts to operations. However, supply chain disruptions persisted for at least 30% of employers throughout the year. While remote work offered benefits, the lack of in-person interactions remained a key challenge, and supply chain concerns were the only pandemic-driven issue that did not decline significantly.
Date: 2022-01-17 | ID: DB_2022-002
Download PDF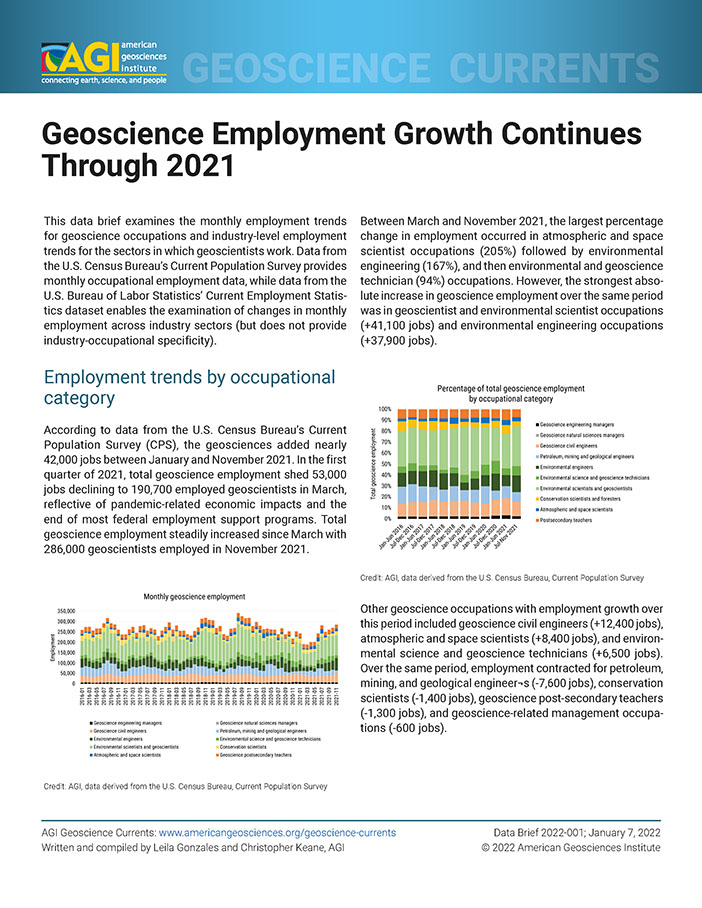
Geoscience Employment Growth Continues Through 2021
The geoscience occupations added nearly 42,000 jobs between January and November 2021, with the largest percentage change in employment occurring in atmospheric and space scientist occupations. Industry-level employment trends showed most sectors gaining employment, with technical consulting and management services experiencing the strongest gains. The labor supply and demand ratios indicate that the professional and business services sector rebounded quickly from pandemic-induced unemployment shocks, while the mining and oil and gas sector remains impacted by the ongoing soft energy market.
Date: 2022-01-07 | ID: DB_2022-001
Download PDF