Introduction
Geologic maps are our most important and complete compilation of information about the solid Earth we live on, and we cannot understand the Earth without them. We use geologic maps and the fundamental information they provide in many ways. Geologic maps help delineate fragile habitat and ecosystems, protect against natural hazards, and find needed resources. The following information is developed from the AGI Environmental Awareness Series book, "Meeting Challenges with Geologic Maps" by William A. Thomas and others (for more AGI publications click here). This information includes some basics about geologic maps, how geologists make geologic maps (contributed by R.D. Hatcher, Jr.), an assessment of the value of geologic maps, and specific examples of how geologic maps have been used to meet challenges across the United States.
It Helps to Know
Explore the topics below by clicking on them for more specific and useful information about geologic maps.
A map scale gives the quantitative relationship, or ratio, between a distance on the map and the actual distance on the ground. For example, on a map of a small area, such as a detailed street map, 1 inch on the map may be at a scale of 1inch on the map equals 20 miles on the ground. Scale is expressed also as a ratio, and a common ratio scale for a detailed geologic map is 1:24,000. At this scale, one inch on the map equals 24,000 inches (2,000 feet) on the ground. The most common geologic map at a scale of 1:24,000 is a 7.5 minute quadrangle measuring 7.5 minutes of latitude by 7.5 minutes of longitude. Larger quadrangles, measuring 30 minutes of latitude by 60 minutes of longitude, are generally produced at a scale of 1:100,000. A small inset diagram on each 30 x 60-minute map shows which 7.5-minute quadrangle maps were used to make it. The entire state of Kentucky has been geologically mapped at a scale of 1:24,000; Kentucky contains more than 700 of these "7.5-minute" quadrangles. In the United States, base maps have not been completed for many large areas.
The level of detail of information presented on a map varies with scale. A 1:24,000-scale geologic map is an excellent source of information for making site-specific decisions about the construction of houses, subdivistions, commercial buildings, airports, dams, and bridges. A 1:100,000-scale map is ideal when a broader regional or county-level perspective is required for making decisions about the construction of highways, watershed management, wetland restoration, and land-use planning. A map scale commonly appears below the center of the map, both as a ratio (e.g., 1:24,000) and in a scale bar. A scale bar shows how distances measured on a map is converted to distance on the ground.
A legend describing the geologic map units and explaining the symbols shown on the map commonly appears along the margin of a geologic map. The descriptions of the map units in the legend commonly are complete enough to enable the user to identify the corresponding rocks on the ground ("in the field"). The map unit descriptions are tied to the geologic map by color and by symbol, and they are listed vertically in the legend in the order of geologic age from youngest to oldest.
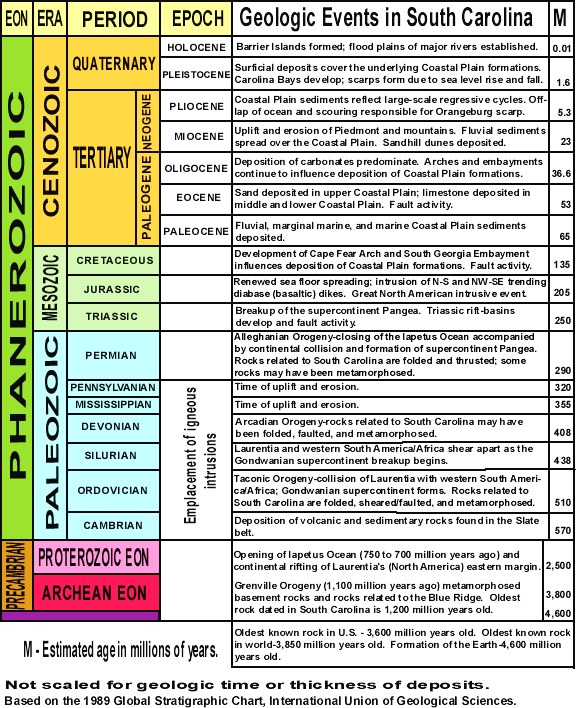
The geologic age of map units is an important part of the information on a geologic map. Standard divisions of Earth history are defined in the geologic time scale, and are used by geologists to identify rock unit ages.
- How Geologists Make Geologic Maps
Making a geologic map requires several decisions before the process actually begins. The area to be mapped and the degree of detail must be decided. These factors largely dictate the map scale. The size of the area is determined from thegeologic problem being addressed. Geologic maps are made of very small areas, such as building foundations, to assess potential engineering problems. Maps of very large areas, such as states or provinces are commonly made by putting together and compiling more detailed, large-scale maps of smaller areas.
If a geologic map is to be made of a relatively small area, the geologist will obtain either aerial photographs, the most detailed topographic maps available, or both. The most common scale for topographic maps used in detailed geologic mapping in the U.S. is the 1:24,000 (1 inch on the map represents 24,000 inches or 2,000 feet on the ground) 7 1/2-minute (7 1/2 minutes of both latitude and longitude) quadrangle. In Canada, the most commonly available topographic map has a 1:50,000 scale (1 cm on the map represents 50,000 cm (500 m on the ground).
Geologist's Tools
Traditional Tools
Tools used by geologists for many decades to make geologic maps include:
- Topographic maps and/or air photos
- Rock Hammer
- Compass with clinometer
- Field book(s) for recording data
- Pencils or pens for writing in field books and on maps
- Protractor
- Field map case for carrying pencils, pens, protractor, scale
- Clipboard or other hard surface for writing
- Protective cover, preferably transparent, for maps/photos
- Marker pen for samples
- Sample bag(s)
- Field vehicle
- Personal items (backpack, rain gear, first aid kit, boots, field clothes)
- Optional: tape recorder, altimeter
Newer Technology Tools
New tools in use by many field geologists today to assist in making geologic maps include:
- Computer for plotting data collected each day, may be loaded with GIS software for direct plotting/recording data.
- Global Positioning Satellite (GPS) receiver provides exact location in unobstructed locations.
In the Field Collecting Data and Making a Geologic Map
A geologist will usually begin a mapping project by obtaining available information on the nature of rocks in the field area, along with any existing geologic maps. Geophysical or subsurface geologic and hydrologic data are assembled. Once in the field, the geologist will begin systematically making observations and measurements along roads, trails, then along streams and ridges, and other places where rocks are likely to be exposed. In an urban area, this would include artificial exposures like highway cuts, quarries, and foundation excavations for new buildings as well as natural exposures in parks and greenways.
Wherever a rock exposure is located, the geologist makes sure of its location on the topographic map or air photo, and records data in a field notebook observations of the kind of rock, the rock unit (formation) if known, and the kind(s) of fossils that may be present. Where the rocks have been deformed,strike and dip of bedding in sedimentary rocks and other planar structures, such as foliation in mmatamorphic rocks will be measured and recorded. One or more of the measurements will be plotted on the map, most commonly bedding or other prominent layering, and mark some color(s) will be used on the map to indicate the rock type(s) present.
Where an exposure is found that contains no structures, color is marked on the map to indicate rock type. Some geologists also record locations of "stations" where data were collected on a separate station map.
Final Results
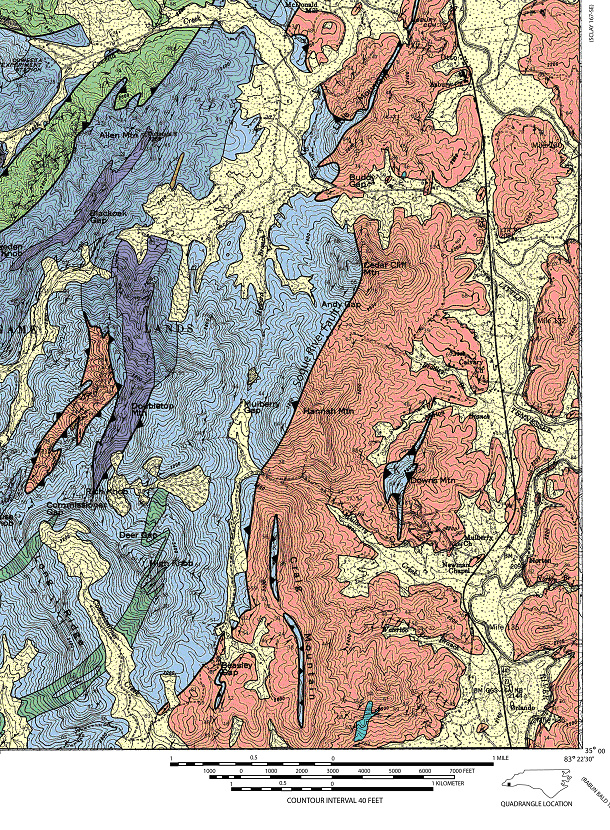
The geologic map, above, is the product of systematic data collection, plotting data on the topographic base map, identification of and drawing boundaries (contacts) between formations, and interpreting the nature of contacts.
Colors represent different formations, with the light tan unit that appears to cut across the others representing the youngest unit: surficial slope and stream deposits. The light orange color is a metasandstone and schist, whereas the light blue is a 468 million-year old granite. The intermediate blue is metasandstone, and the darker blue unit is garnet schist. The dark green formation consists of metavolcanic rock and the medium green in the northwest part of the map consists of another metasandstone. Lines with teeth on them have been interpreted as thrust faults, whereas all other boundaries are interpreted as normal contacts between sedimentary or igneous rock units.
The various symbols with numbers beside them are mostly measurements of strike and dip of layering (here foliation, because these are metamorphic rocks); others represent the orientations of other structures.
Geologic maps are the single most important and valuable tool we have for understanding and living with the Earth around us. Their usefulness is so broad that geologic maps are the most requested scientific product produced by state and federal geological surveys. Kentucky's experience with geologic maps exemplifies their value and utility.
Through a partnership with the Kentucky Geological Survey and the U.S. Geological Survey (1960-1978), Kentucky became the first state to be entirely mapped geologically at a scale of 1:24,000. This program produced 707 detailed geologic maps that originally were intended for use in natural resource development. Since that time they have become important to every aspect of land use in Kentucky, including pollution prevention and clean up, transportation planning, and making site-specific decisions about the construction of houses, subdivisions, commercial buildings, airports, dams, and bridges.
The usefulness of the Kentucky geologic maps clearly demonstrates the economic value of producing geologic maps. However, Kentucky is the exception. Less than 1/3 of the US has been geologically mapped at 1:24,000 scale. Completing the job will require continued efforts and support by government, university, and other organizations to provide the geologic maps we need to understand and live with the Earth around us.
For additional basic information about geologic maps, visit this USGS/NPS website.
Download a pdf of the entire book by clicking here (8.1 MB). (You will need Adobe Acrobat Reader to view this pdf file).
Examples of Geologic Maps Meeting Challenges
The following examples represent the wide range of geologic map uses. The examples are widely distributed geographically, as geologic maps have valuable uses in every part of our country, and throughout the world. The maps are organized in four subject categories: Environment, Hazard Mitigation, Resource Evaluation, and Land Use Planning. Click on any map name below to view the example. You will need Adobe Acrobat to view the examples. Click here to get Adobe, if you do not have it already installed on your computer.
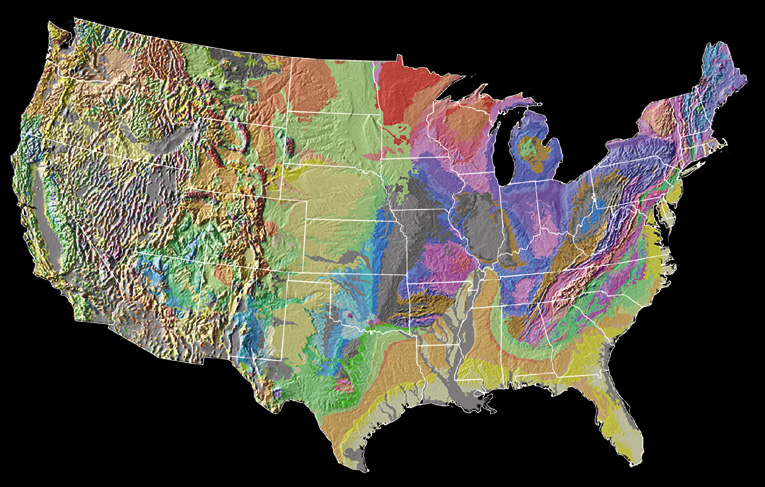
Click here for a U.S. map (11.9 MB) showing the location of the examples. (Note: Right-click the link to save the document before opening, if you're working over a slower connection.)
Environment
- Habitat Prediction, UT (0.2 MB)
- Protecting Groundwater, AL (0.2 MB)
- Delineation of Ecosystems, Appalachians (0.2 MB)
- Grand Canyon, AZ (1.7 MB)
Hazard Mitigation
- Landslide Hazards, KS
- Sinkhole Susceptibility, MD
- Landslide Hazards, CA
- Earthquake Damage Prediction, NJ
- Post-Wildfire Hazards, CO
- Volcanic Hazards, WA
- Mitigation of Earthquake Damage, AK
- Landslide Susceptability, CO (1.69 MB)
- Radioactive Drinking Water, NH
- Collapsable Soil and Karst Hazards, CO (1.72 MB)
- Earthquake and Landslide Hazards, CA (16.4 MB)
- Geologic Hazards, ID (0.9 MB)
- Flood Hazards, NE (1.26 MB)
- Geologic Hazards, UT (0.9 MB)
Resource Evaluation
- Mineral Resources, NV
- Delineating Sand and Gravel, CO
- Coal Resources and Past Mining, PA
- Finding Groundwater, NM
- Petroleum Systems, AK
- Geology and Groundwater, NM (1.36 MB)
- Aquifers, IL (0.5 MB)
- Hydrogeology, WA (1 MB)
- Groundwater, VA (1.52 MB)
- Aquifers, ME (0.6 MB)
Land Use Planning
- Cave Resources, KY
- Power Plant Development, NY (0.4 MB)
- Transportation, ND
- Development, AL (0.6 MB)
- Washington DC (0.5 MB)
- Karst Topography, FL (1.76 MB)
----- ----- ----- ----- ----- ----- ----- ----- ----- ----- ----- ----- ----- ----- ----- ----- ----- ----- ----- ----- ----- ----- ----- ----- ----- ----- ----- ----- ----- ----- ----- ----- ---------- ----- ----- ----- ----- -----


