The Utah Geological Survey provides an online interactive map of geothermal wells and springs in Utah. Detailed information on location and fluid chemistry is available for many sites.
It's Groundwater Awareness Week 2017 (#GWAwarenessWeek if you're on twitter)! Today's Critical Issues Map of the Day from the USGS and shows the cumulative depletion of groundwater for 40 aquifer systems across the U.S (excluding Alaska). The map depicts depletion over the time period of 1900 to 2008 and is measured in cubic kilometers.
While it's been a wet winter for California, there are many places in the Eastern U.S. that experiencing below normal streamflow. Today's "Map of the Day" is from the U.S. Geological Survey WaterWatch program. The map identifies drought conditions ranging from extreme hydrological droughts to below normal streamflow conditions across the entire U.S.
Please note: the image above is provided as a sample only, and indicates water levels in Californian reservoirs as of November 26th, 2018. Please click on the image or this link to access the up-to-date interactive map. If the map is unavailable, you can find daily information on water levels for Californian reservoirs by clicking here.
The Tsunami Evacuation Map from the Washington Division of Geology and Earth Resources provides a large amount of information about tsunami evacuation procedures for the state of Washington. Each of the shaded areas in the image above can be zoomed in on for more detailed information including:
The Washington State Coal Mine Map Collection from the Washington Division of Geology and Earth Resources allows users to find maps of coal mines (including abandoned coal mines) in the state of Washington. The interactive atlas provides shaded "map areas" that the user can click on to find maps of coal mines in each area.
The Pennsylvania Department of Environmental Protection provides a large amount of information on oil and gas wells in the state in an interactive map. The map includes detailed information on wells across the state, generally split into conventional (blue) and unconventional (red) wells, and including:
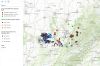
 map of groundwater depletion. Image Credit: USGS")

