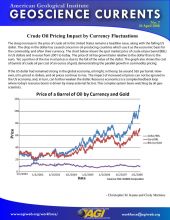
This data brief examines the changes in the spot price of crude oil per barrel (BBL) in U.S. dollars and euros from 2018 through March 2020. This period covers the market contraction in late 2018-early 2019 and the beginning of the economic downturn from the COVID-19 pandemic and the oil price war between Saudi Arabia and Russia. The graph also shows the cost of barrels of crude oil per Troy ounce of gold, demonstrating the inverse relationship between the price of oil and a wealth reserve commodity such as gold.
The U.S. dollar/euro exchange rate over this period narrowed from 0.80 in January 2018 to 0.93 in late February 2020, after which the exchange rate fluctuated between 0.87 and 0.94. Oil prices in 2020 peaked at just over $63 per barrel on 6 January and declined to $19.48 on 20 March. It remains to be seen how the economic impacts of the oil price war and the COVID-19 pandemic will play out over the coming months.
")