This data brief examines the monthly employment trends for geoscience occupations and industry-level employment trends for the sectors in which geoscientists work. Data from the U.S. Census Bureau’s Current Population Survey provides monthly occupational employment data, while data from the U.S. Bureau of Labor Statistics’ Current Employment Statistics dataset enables the examination of changes in monthly employment across industry sectors (but does not provide industry-occupational specificity).
Employment trends by occupational category
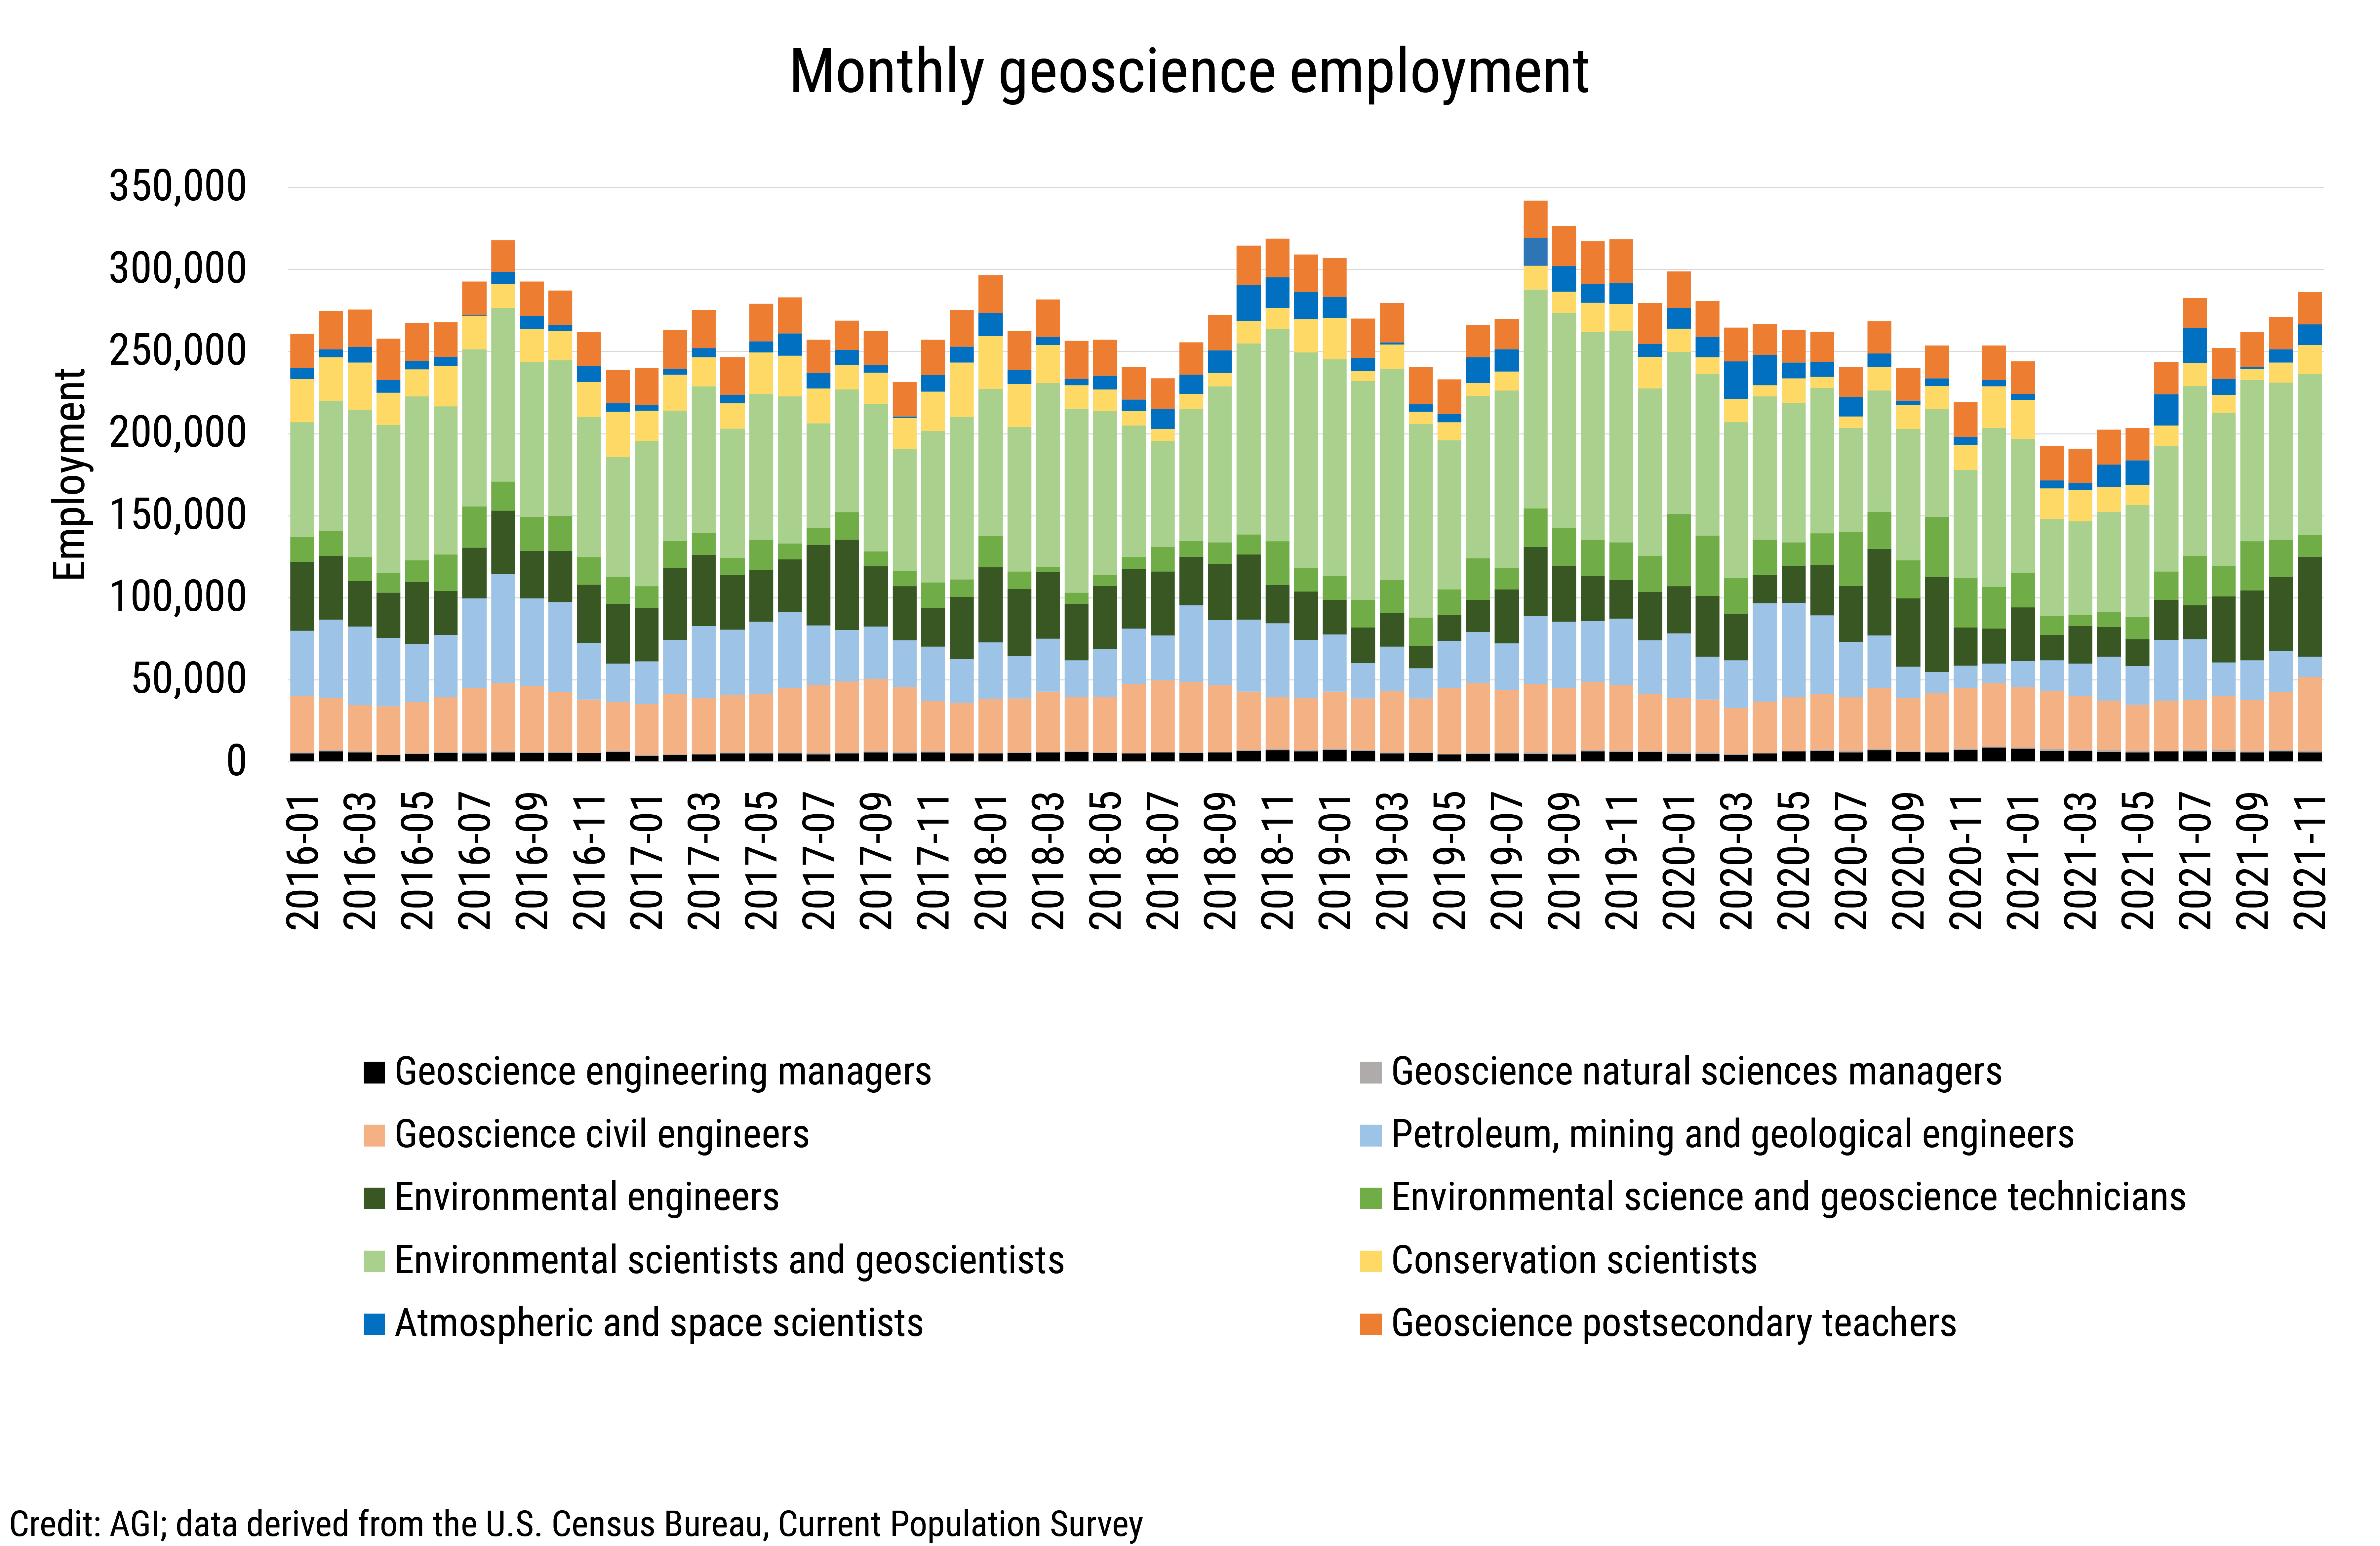
According to data from the U.S. Census Bureau’s Current Population Survey (CPS), the geosciences added nearly 42,000 jobs between January and November 2021. In the first quarter of 2021, total geoscience employment shed 53,000 jobs declining to 190,700 employed geoscientists in March, reflective of pandemic-related economic impacts and the end of most federal employment support programs. Total geoscience employment steadily increased since March with 286,000 geoscientists employed in November 2021.
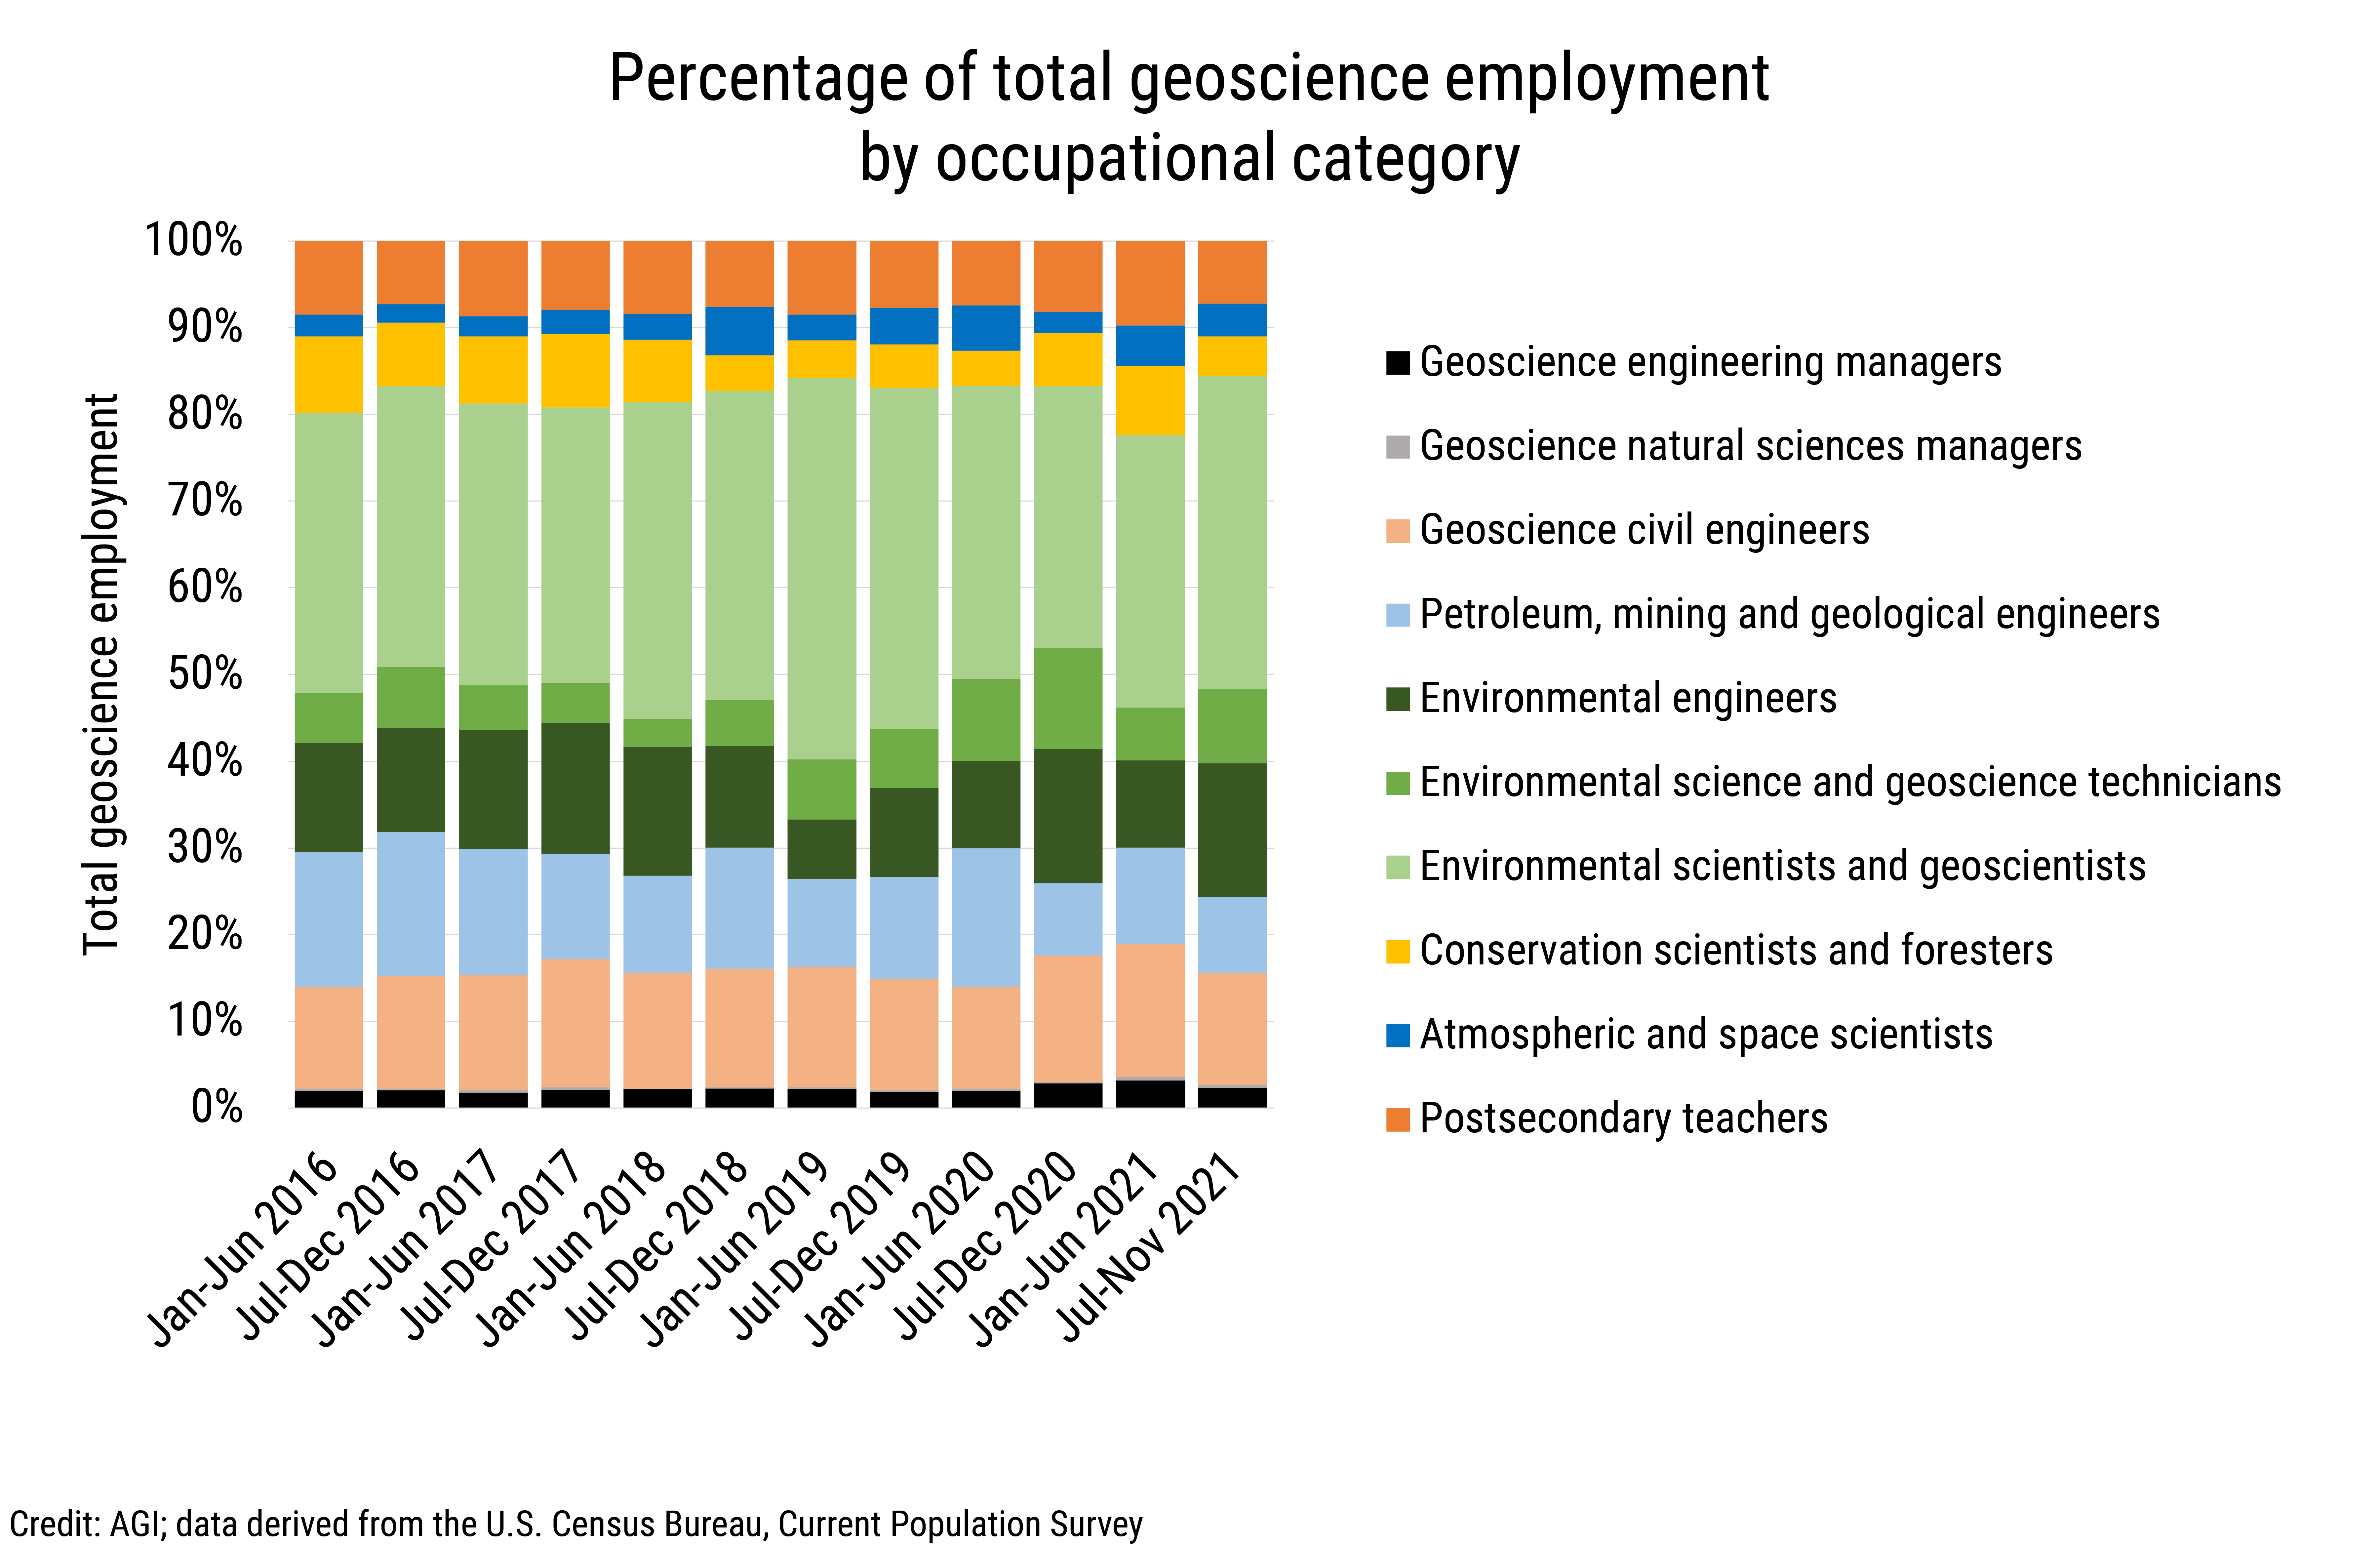
Between March and November 2021, the largest percentage change in employment occurred in atmospheric and space scientist occupations (205%) followed by environmental engineering (167%), and then environmental and geoscience technician (94%) occupations. However, the strongest absolute increase in geoscience employment over the same period was in geoscientist and environmental scientist occupations (+41,100 jobs) and environmental engineering occupations (+37,900 jobs).
Other geoscience occupations with employment growth over this period included geoscience civil engineers (+12,400 jobs), atmospheric and space scientists (+8,400 jobs), and environmental science and geoscience technicians (+6,500 jobs). Over the same period, employment contracted for petroleum, mining, and geological engineers (-7,600 jobs), conservation scientists (-1,400 jobs), geoscience post-secondary teachers (-1,300 jobs), and geoscience-related management occupations (-600 jobs).
Employment trends by industry
The U.S. Bureau of Labor Statistics’ Current Employment Statistics dataset provides insight into monthly changes in total employment across industry sectors; however, the data does not provide the granularity to examine occupational employment trends within industry sectors.
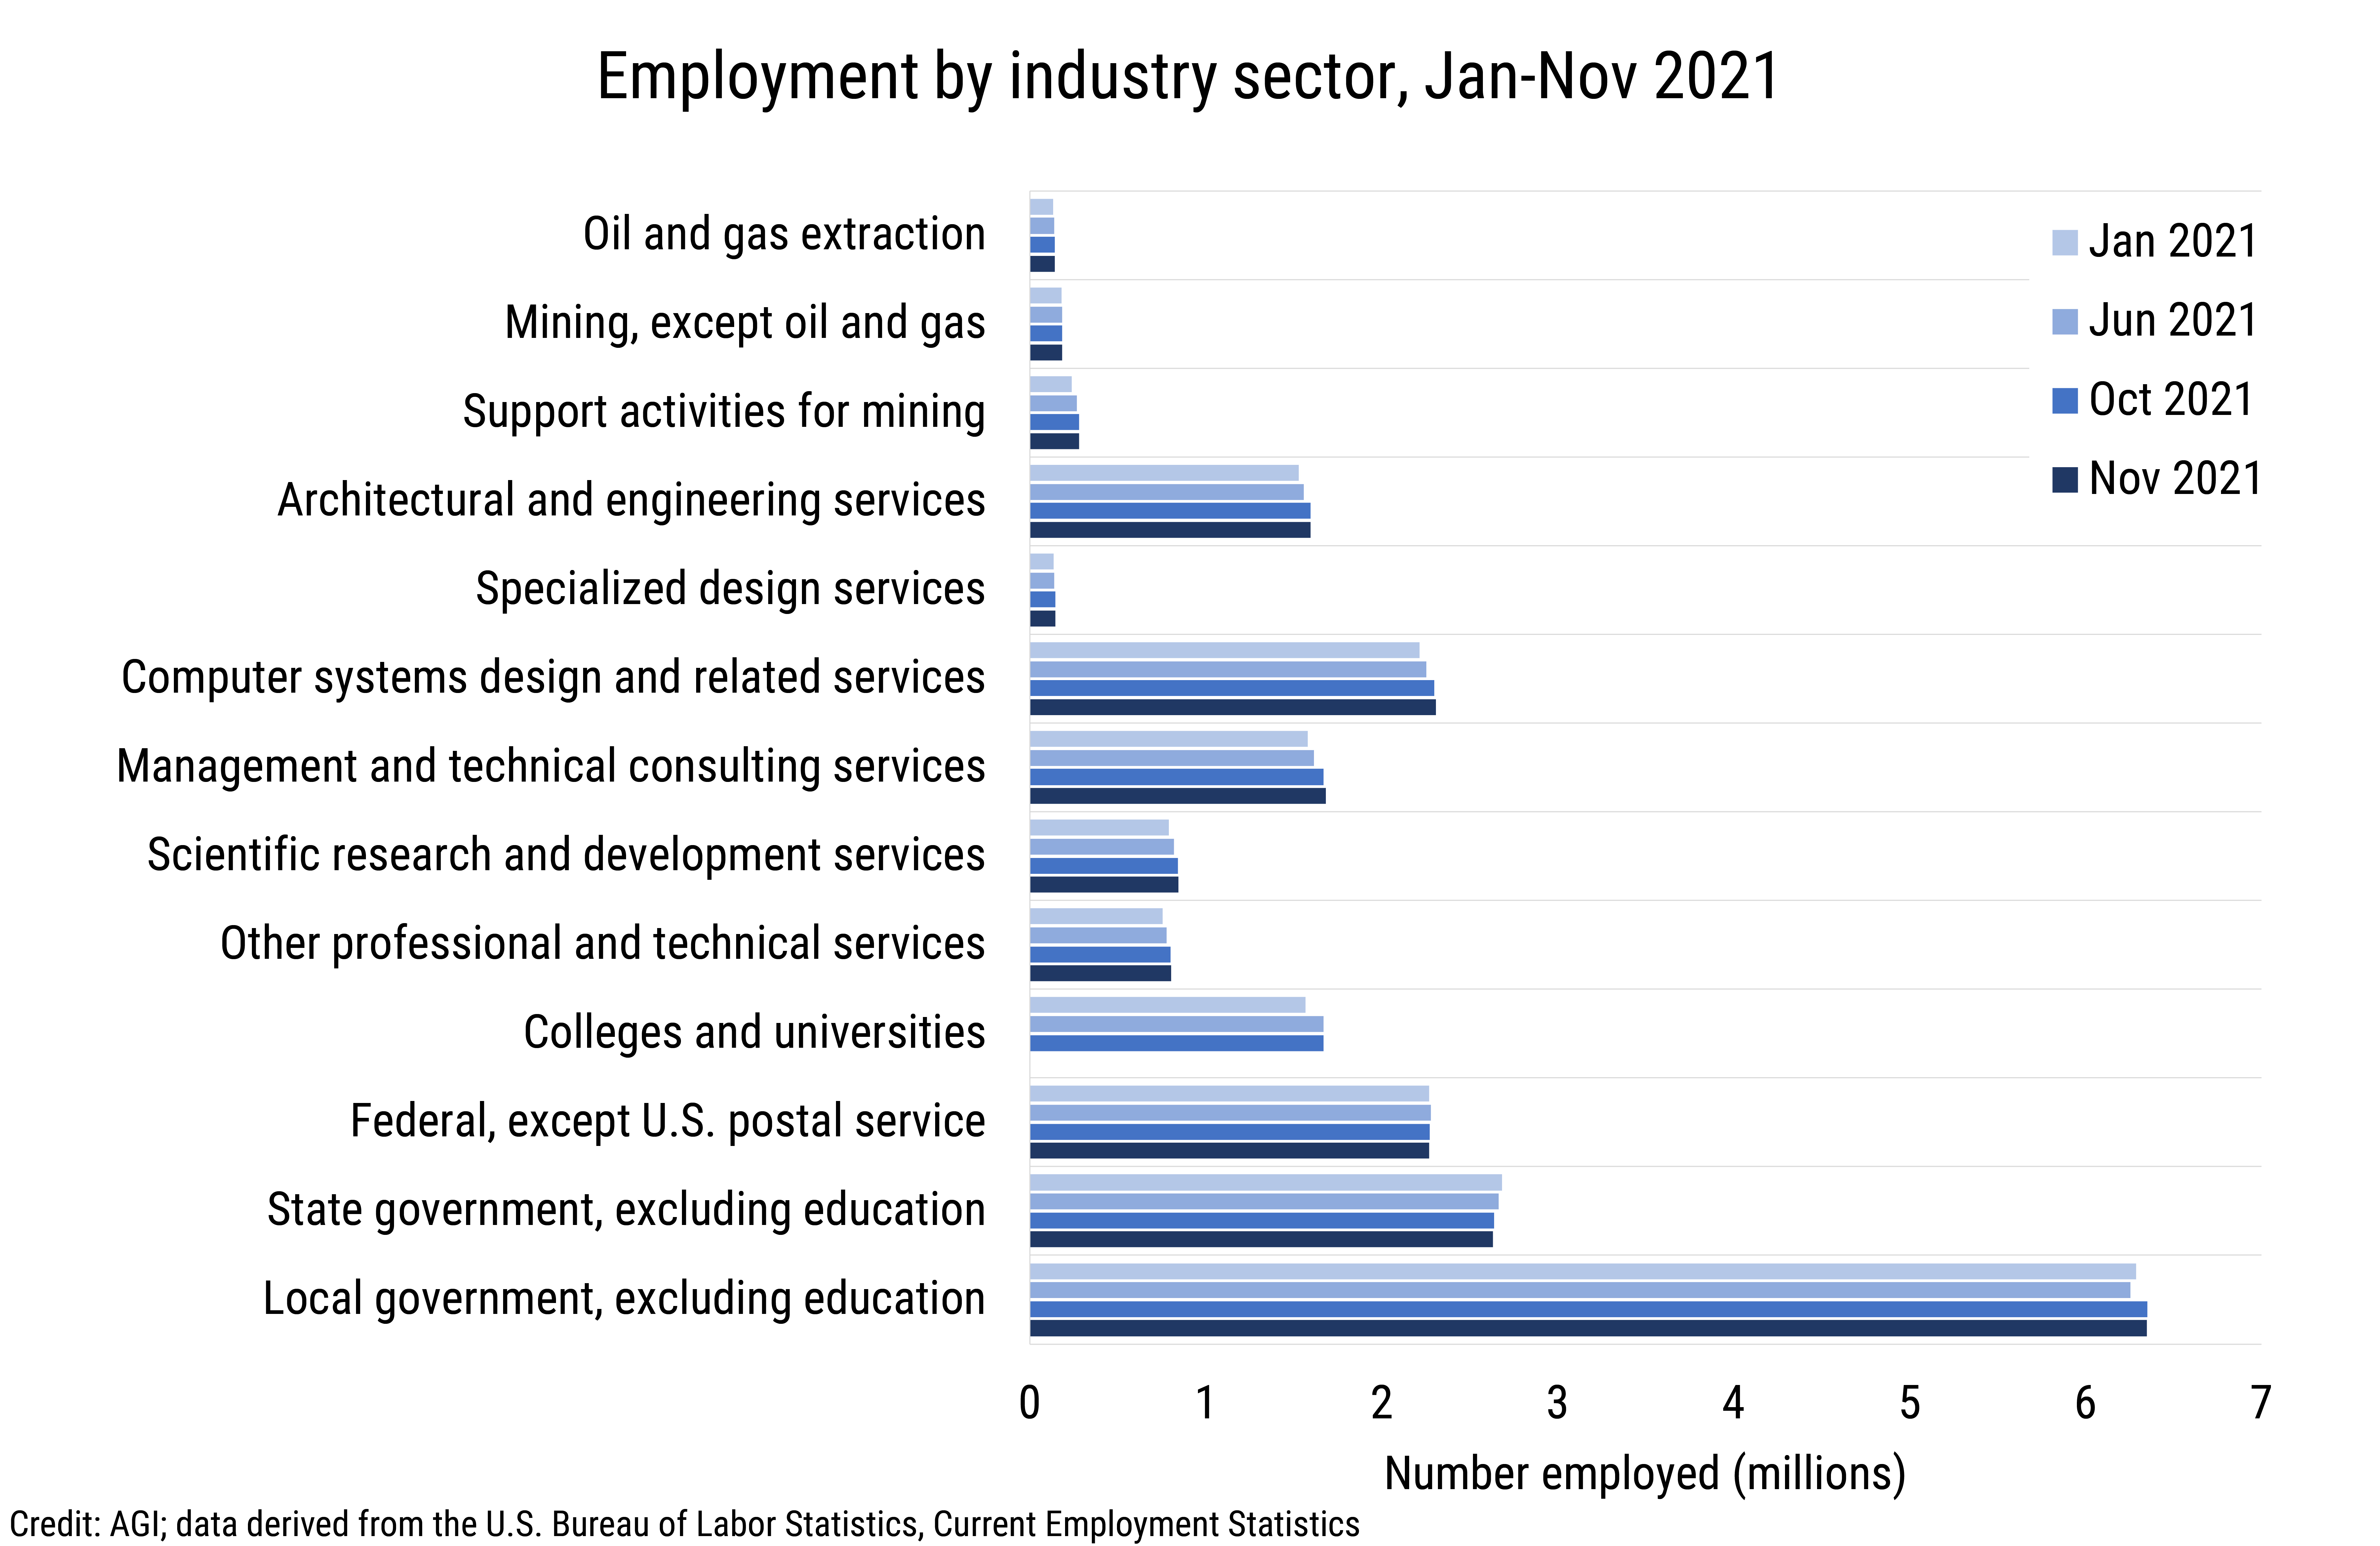
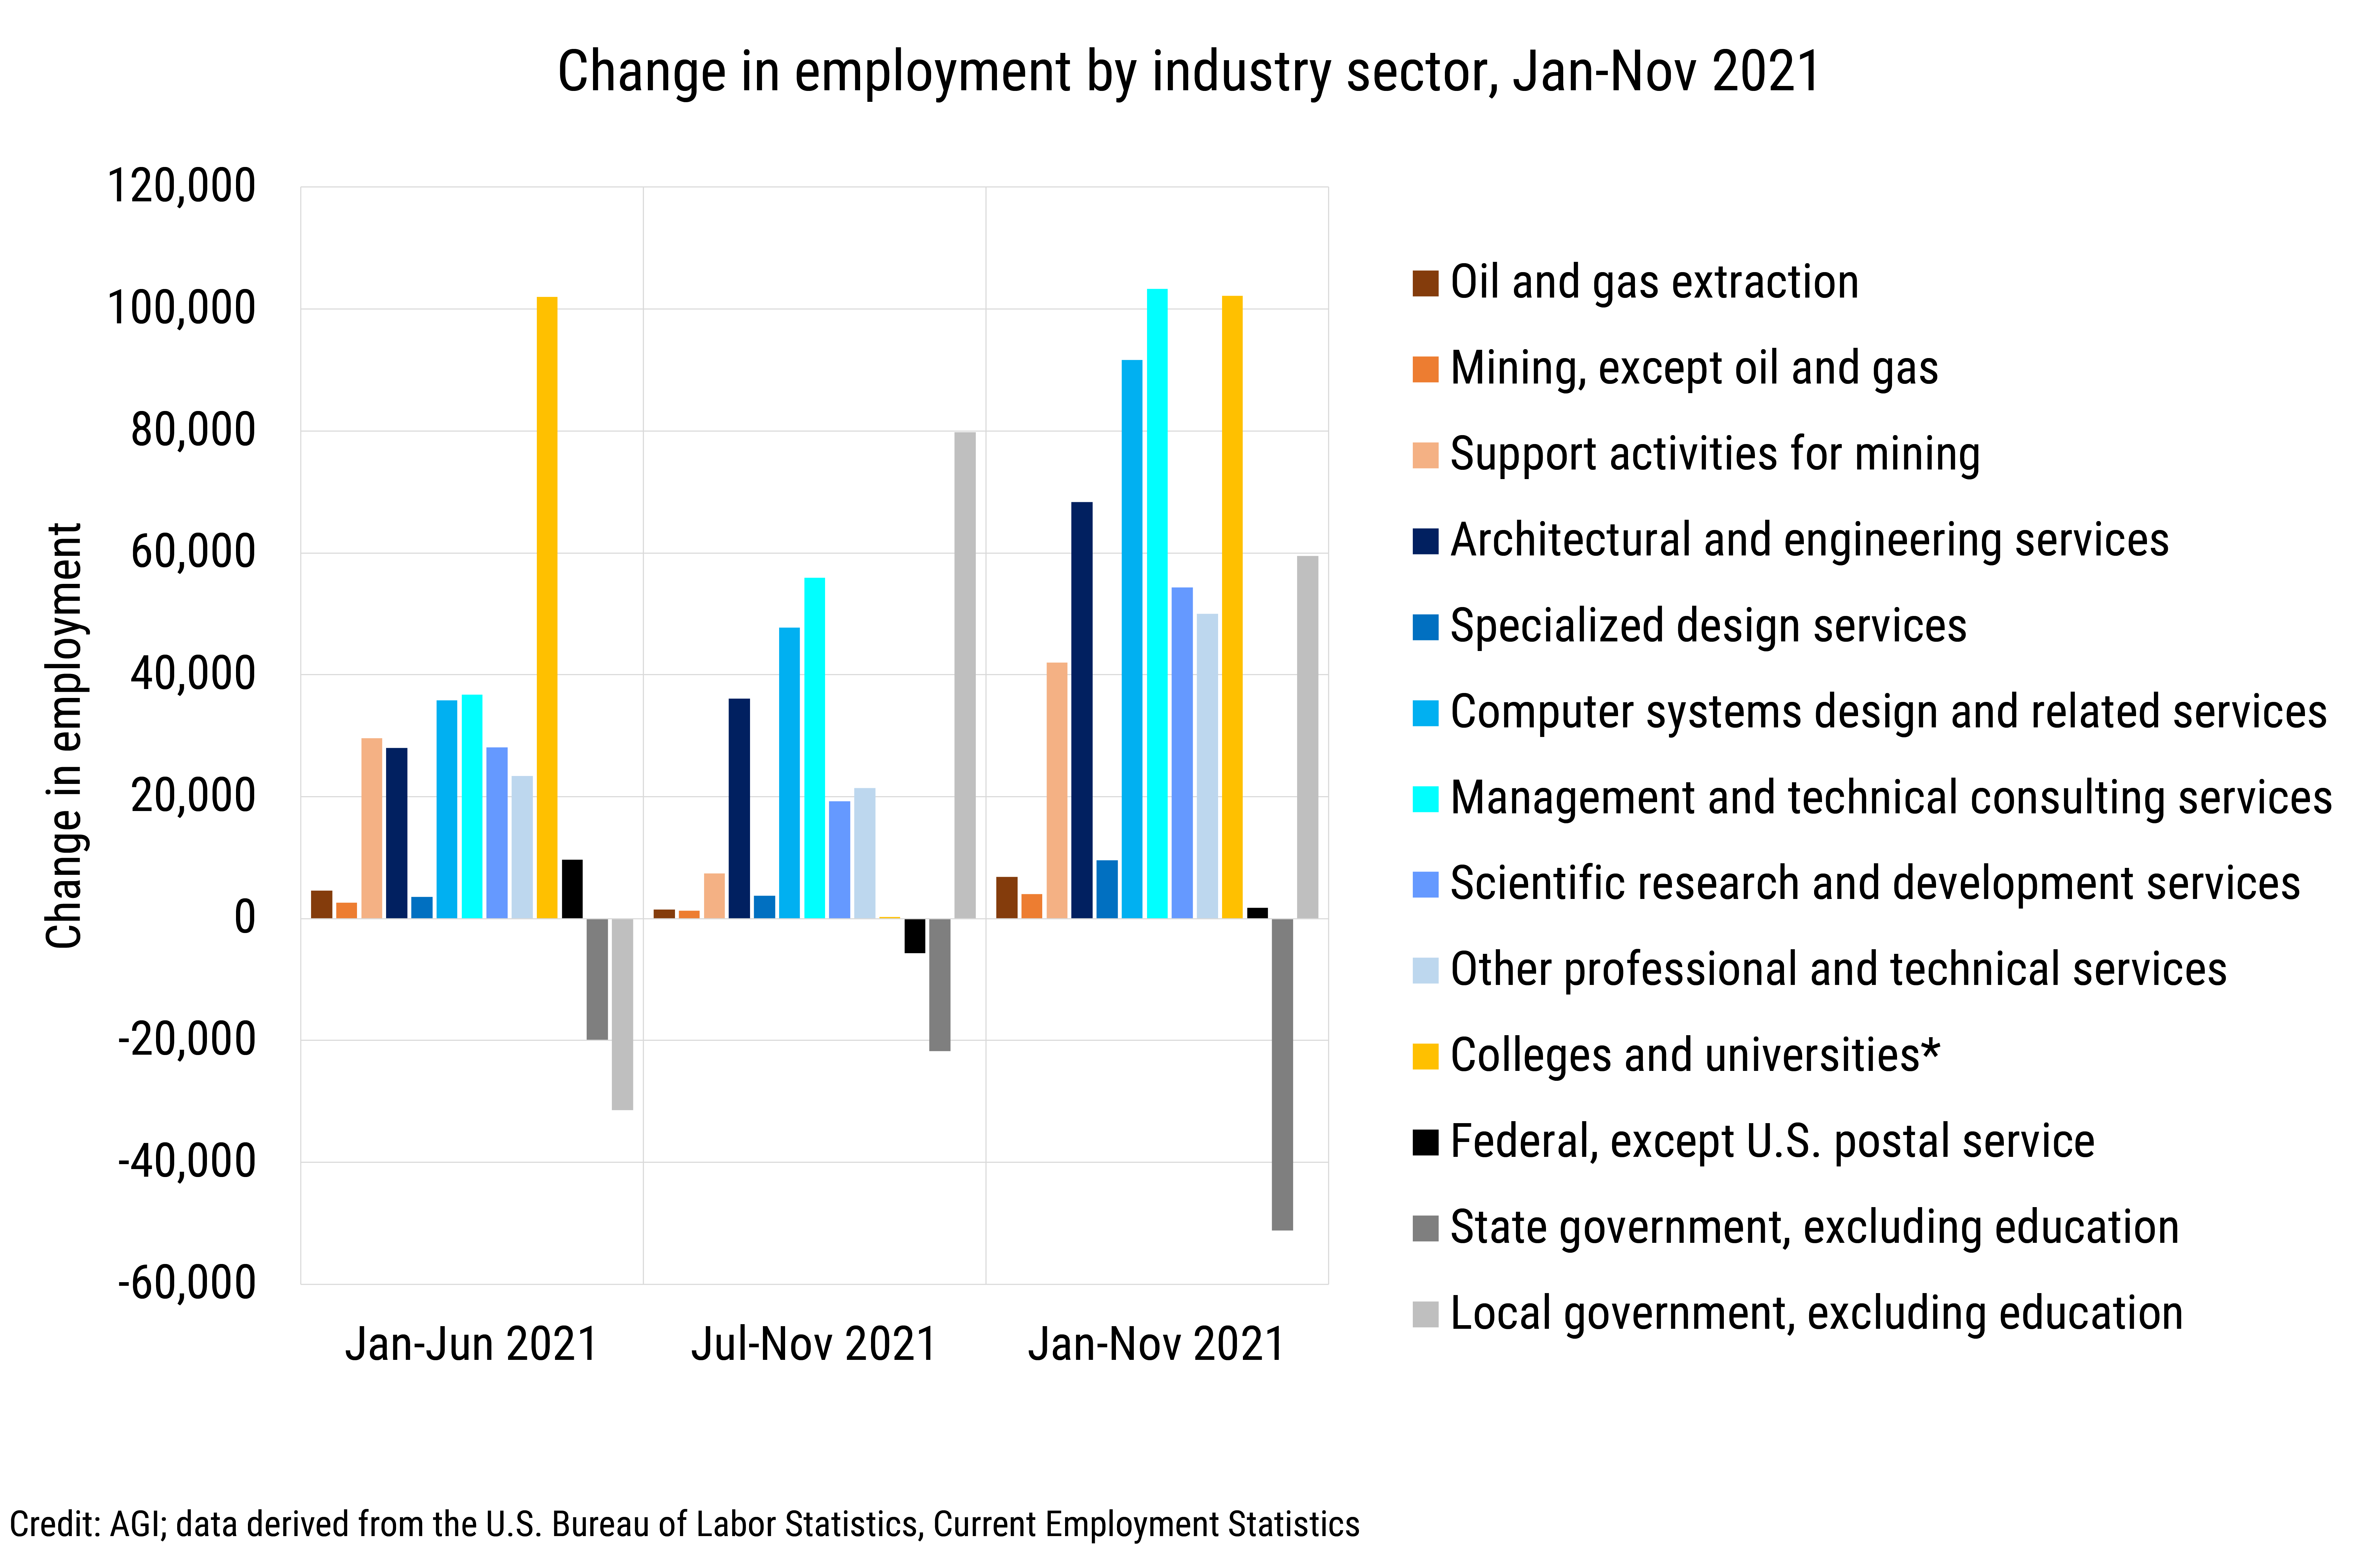
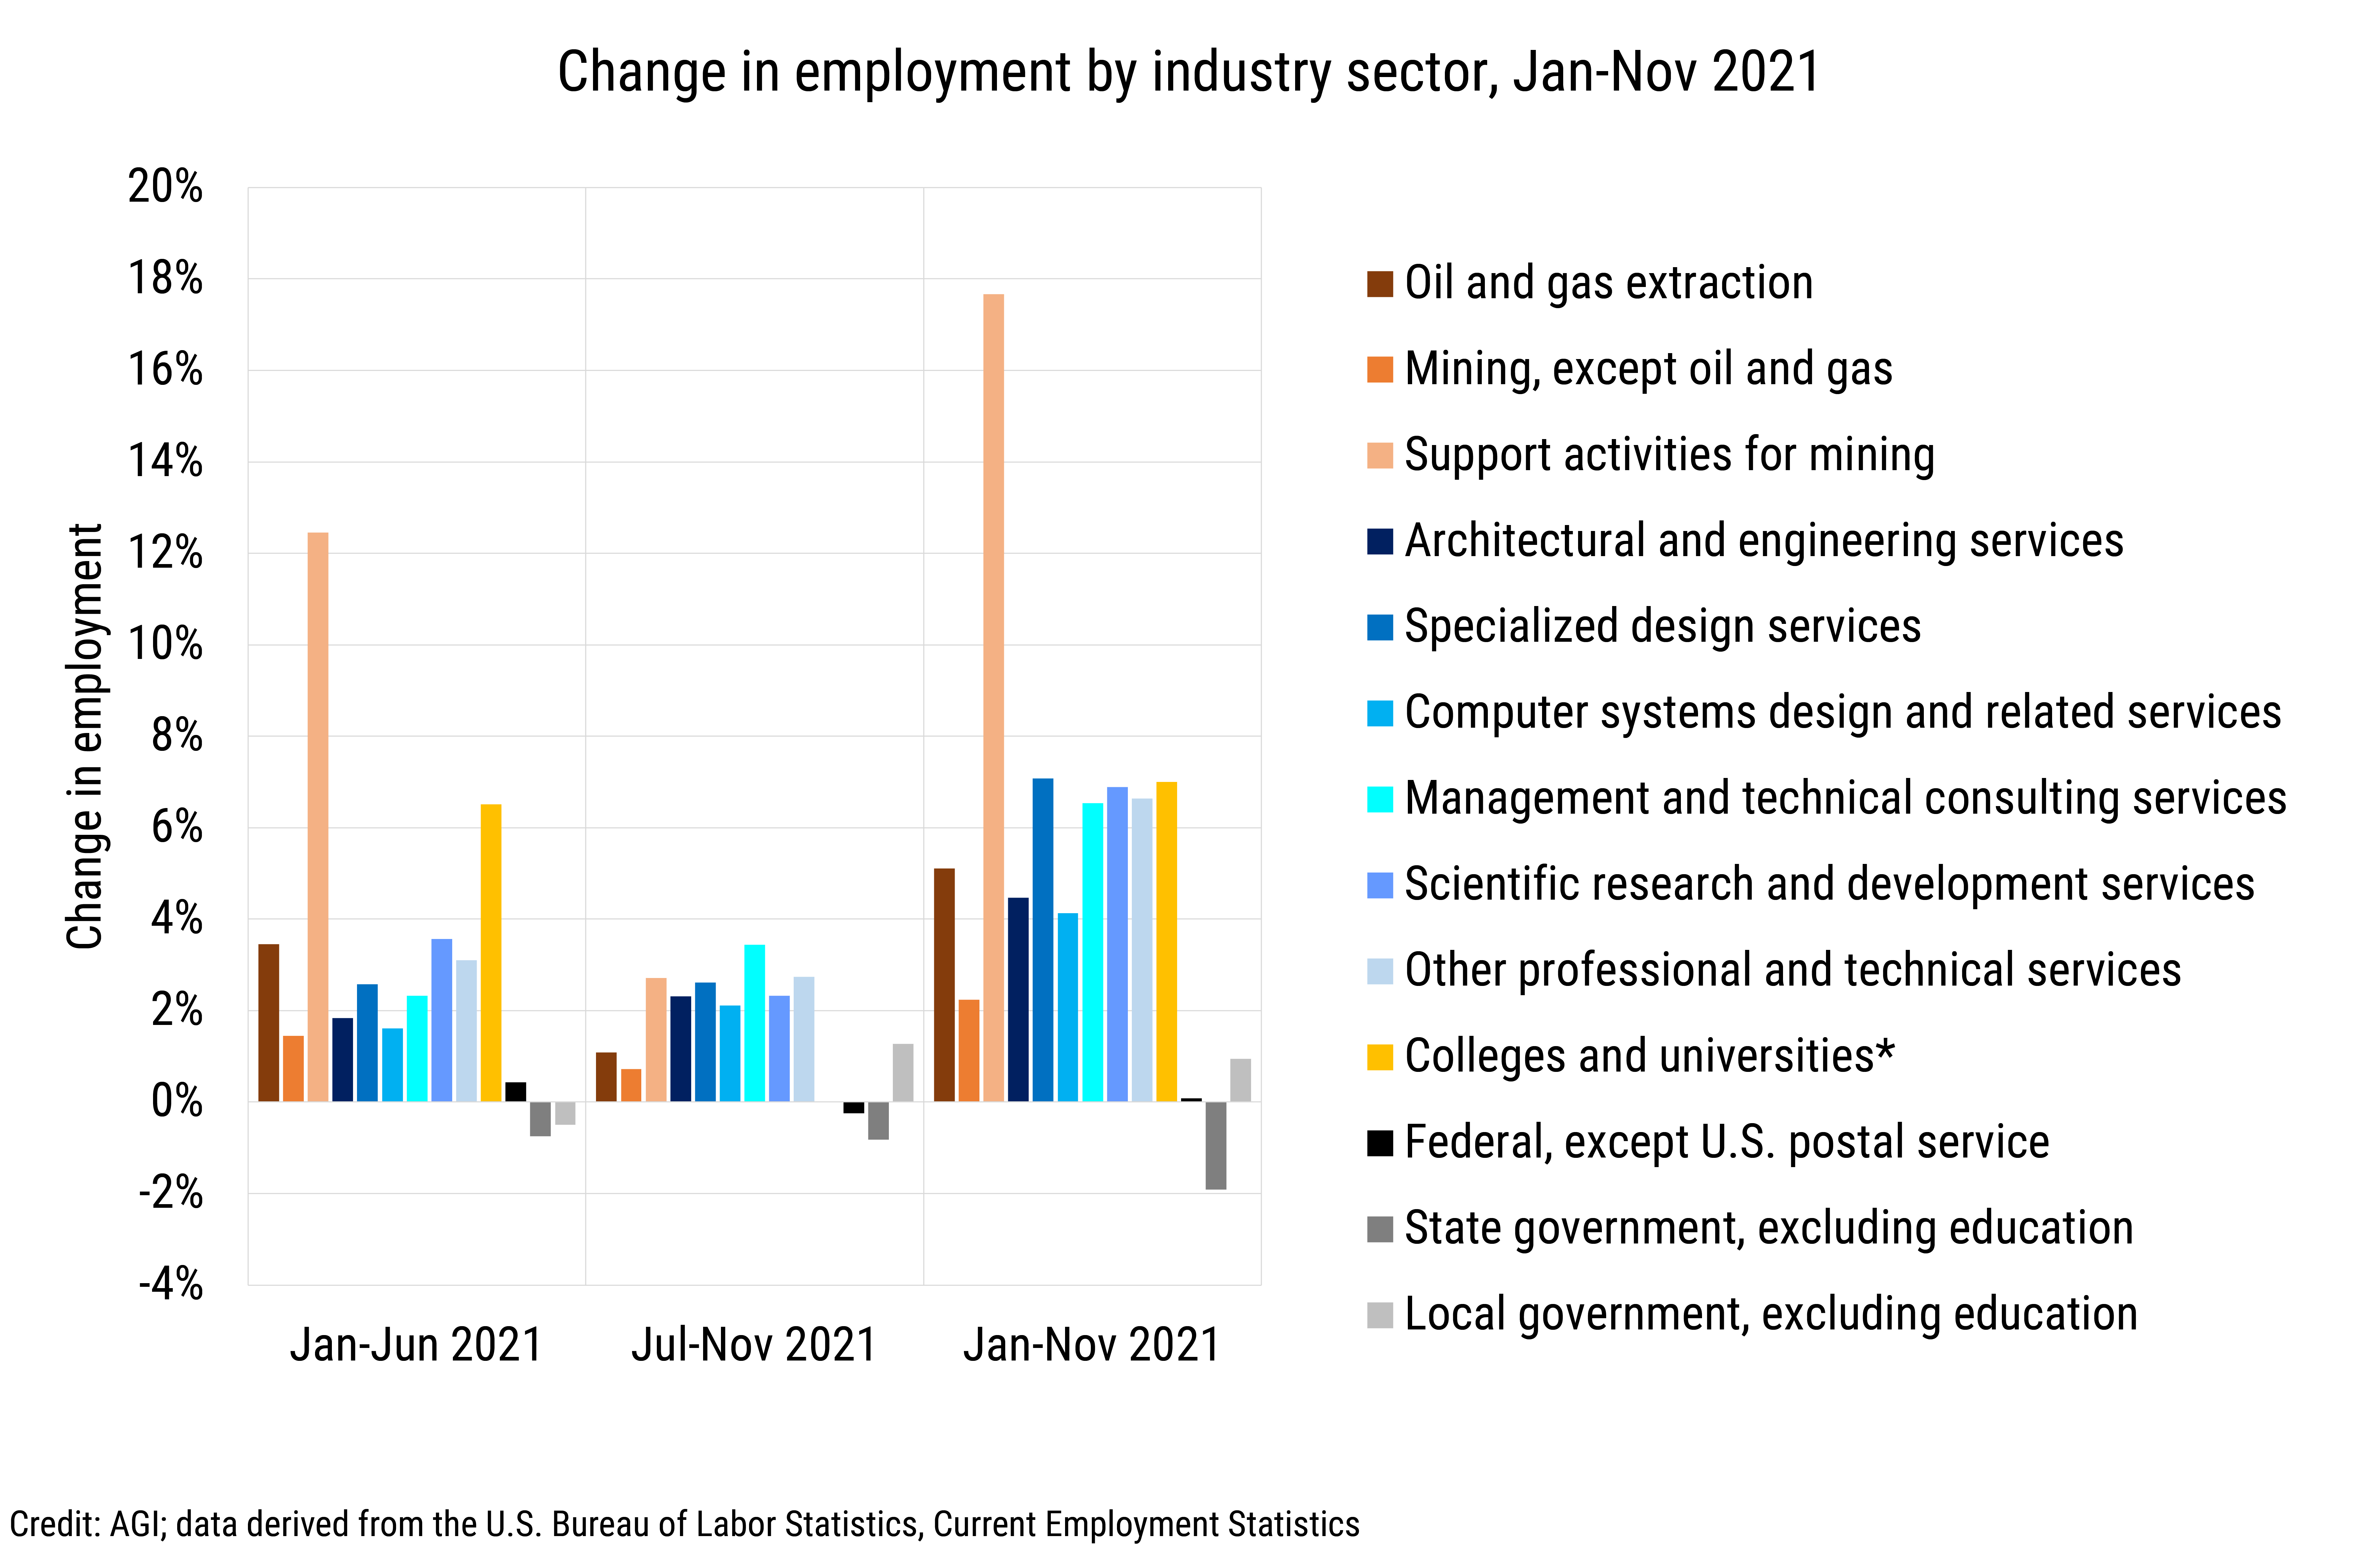
Between January and November 2021, most industry sectors in which geoscientists work saw employment gains, except for state government which lost 51,200 jobs respectively. The industry sectors of importance to geoscientists with the largest gains over this period included technical consulting and management services (+103,300 jobs), computer systems design and related services (+91,600 jobs), architectural and engineering services (+68,300 jobs), scientific research and development services (+54,300 jobs), and other professional and technical services (+50,000 jobs). November 2021 data was not available for the colleges and university sector at the time of this data brief; however, this sector gained 102,200 jobs between January and October 2021.
Total employment gains were strongest during the first half of 2021 for the colleges and universities sector and the extractive industry sectors. During the second half of the year, employment gains were strongest for most sectors related to technical consulting and management services, except for scientific research and development services and other professional and technical services sectors. The federal government sector added jobs during the first half of 2021 yet shed jobs during the second half of the year, while the local government sector did the opposite, and the state government sector shed jobs throughout the entire year.
Higher education employment gains in the first half of the 2021 were likely influenced by the pandemic-related disruptions during 2020, and employment gains in March 2021 reflect the resumption of in-person learning and opening of campuses across the nation. The large fluctuations in local government employment are also likely related to impacts from the pandemic as well as to the availability of federal aid, but to date, insight into the drivers in these employment trends has not been provided in the U.S. Bureau of Labor Statistics’ reports.
The support activities for mining sector, which includes support activities for the oil and gas industry, saw the largest growth in employment between January and November 2021, with employment gains of nearly 18% that were driven by the support activities for oil and gas operations sector recovering some from the extreme losses over the prior year. Other sectors that grew by 5% or more included professional, scientific and technical consulting and the oil and gas extraction sector. Over the same period, slower employment growth occurred in the computer systems design and architectural engineering sectors, mining sector, and local government sector.
* Note that employment data for the colleges and universities sector in the above figures is for January through October 2021 since November 2021 data was not available.
Estimating supply and demand
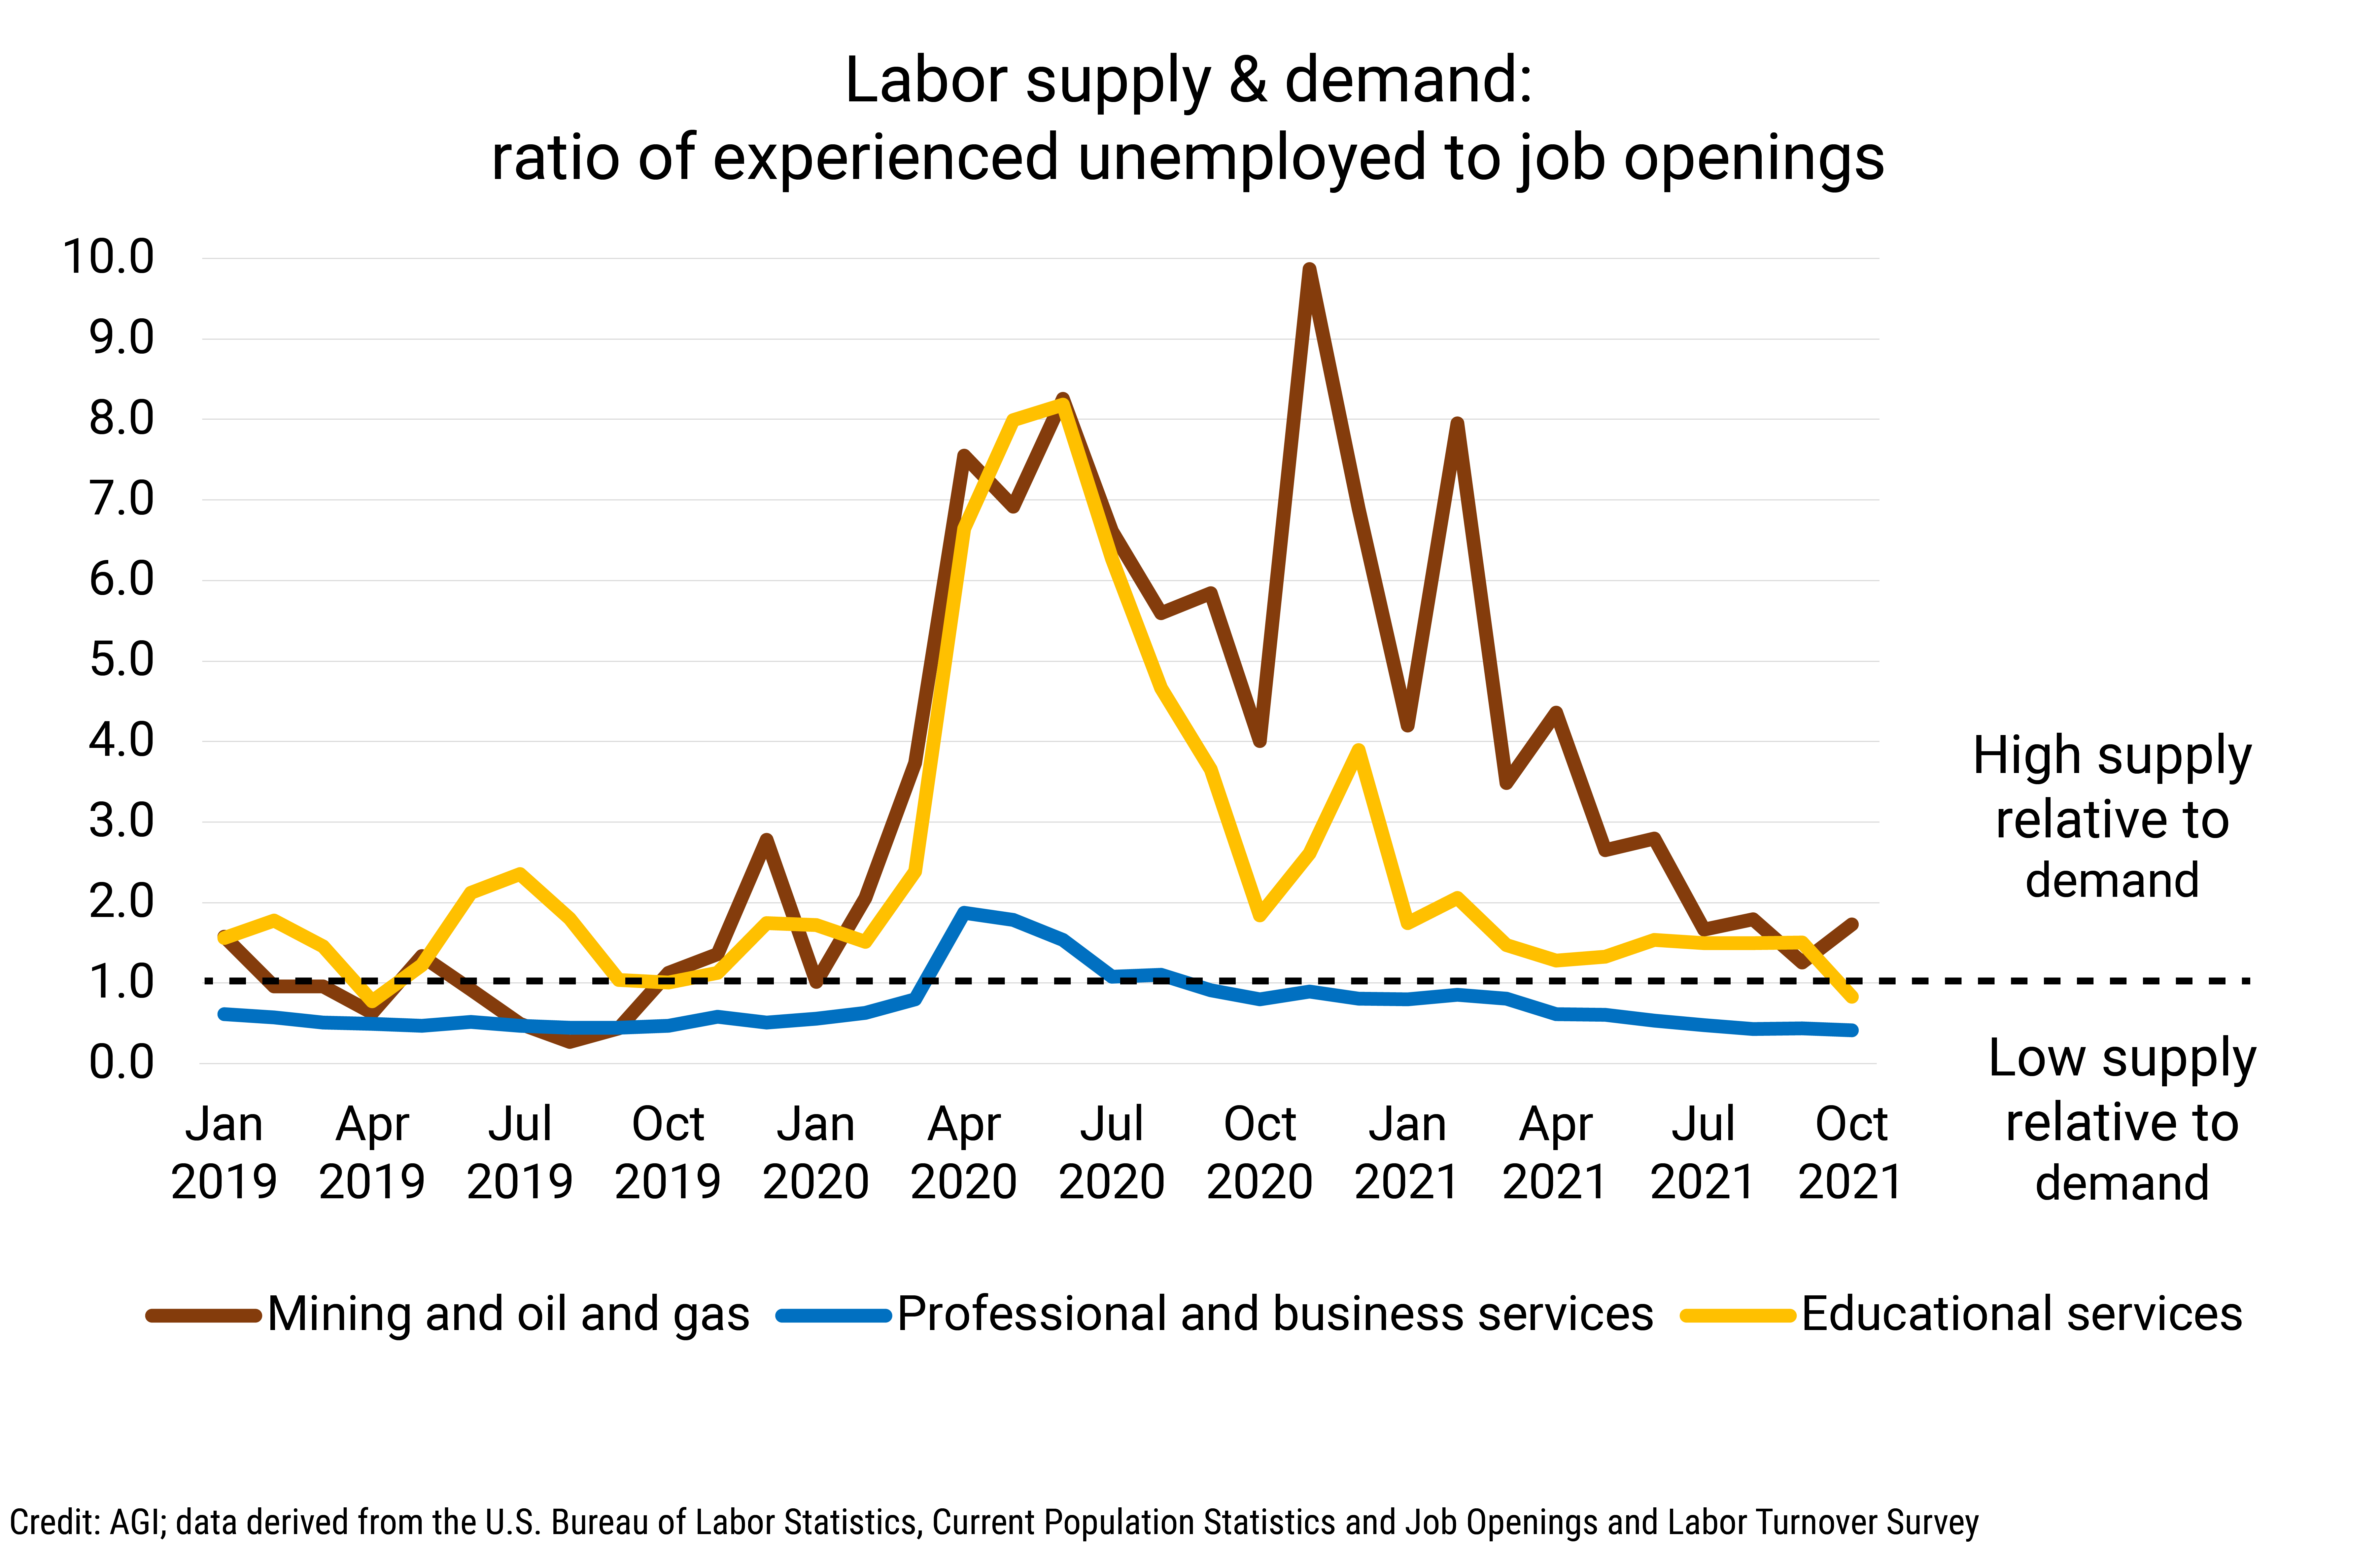
We used the methodology from the U.S. Bureau of Labor Statistics1 to estimate monthly labor supply and demand since 2019 in three key industry sectors where geoscientists work: mining and oil and gas, professional and business services, and educational services. (Data needed for estimating government labor supply and demand was not available). The ratio of experienced unemployed workers to the number of job openings in a given industry indicates the level of supply relative to the demand. Ratios greater than 1 indicate that the supply of experienced unemployed workers is high relative to labor demand. Ratios less than 1 indicate that the supply of experienced unemployed workers is low relative to the demand for labor.
From a labor supply and demand perspective, the professional and business services sector had the shortest duration of impact from the pandemic, with excess demand returning by mid-2020 and back to pre-pandemic levels by the summer of 2021. The mining and oil and gas sector was substantially impacted by the soft energy market starting in late 2019, as well as by the shock of the pandemic, including the reduced demand for oil and gas due to the decline in international and domestic travel. The ongoing strong demand in the mining sector was swamped by the exodus of professionals from the oil and gas industry with some of the excess being reduced in 2021 and driven by minor recovery in oil and gas, but likely representing substantial exiting of those individuals from the sector. The educational services sector was also heavily impacted by the pandemic with campus closures, layoffs, and lower enrollments through 2020, although the ratio of experienced unemployed workers to demand for labor returned to pre-pandemic levels by early 2021. The labor supply and demand ratios seen in October 2021 are in line with geoscience employer reports regarding their ability to find and hire geoscientists in these sectors.
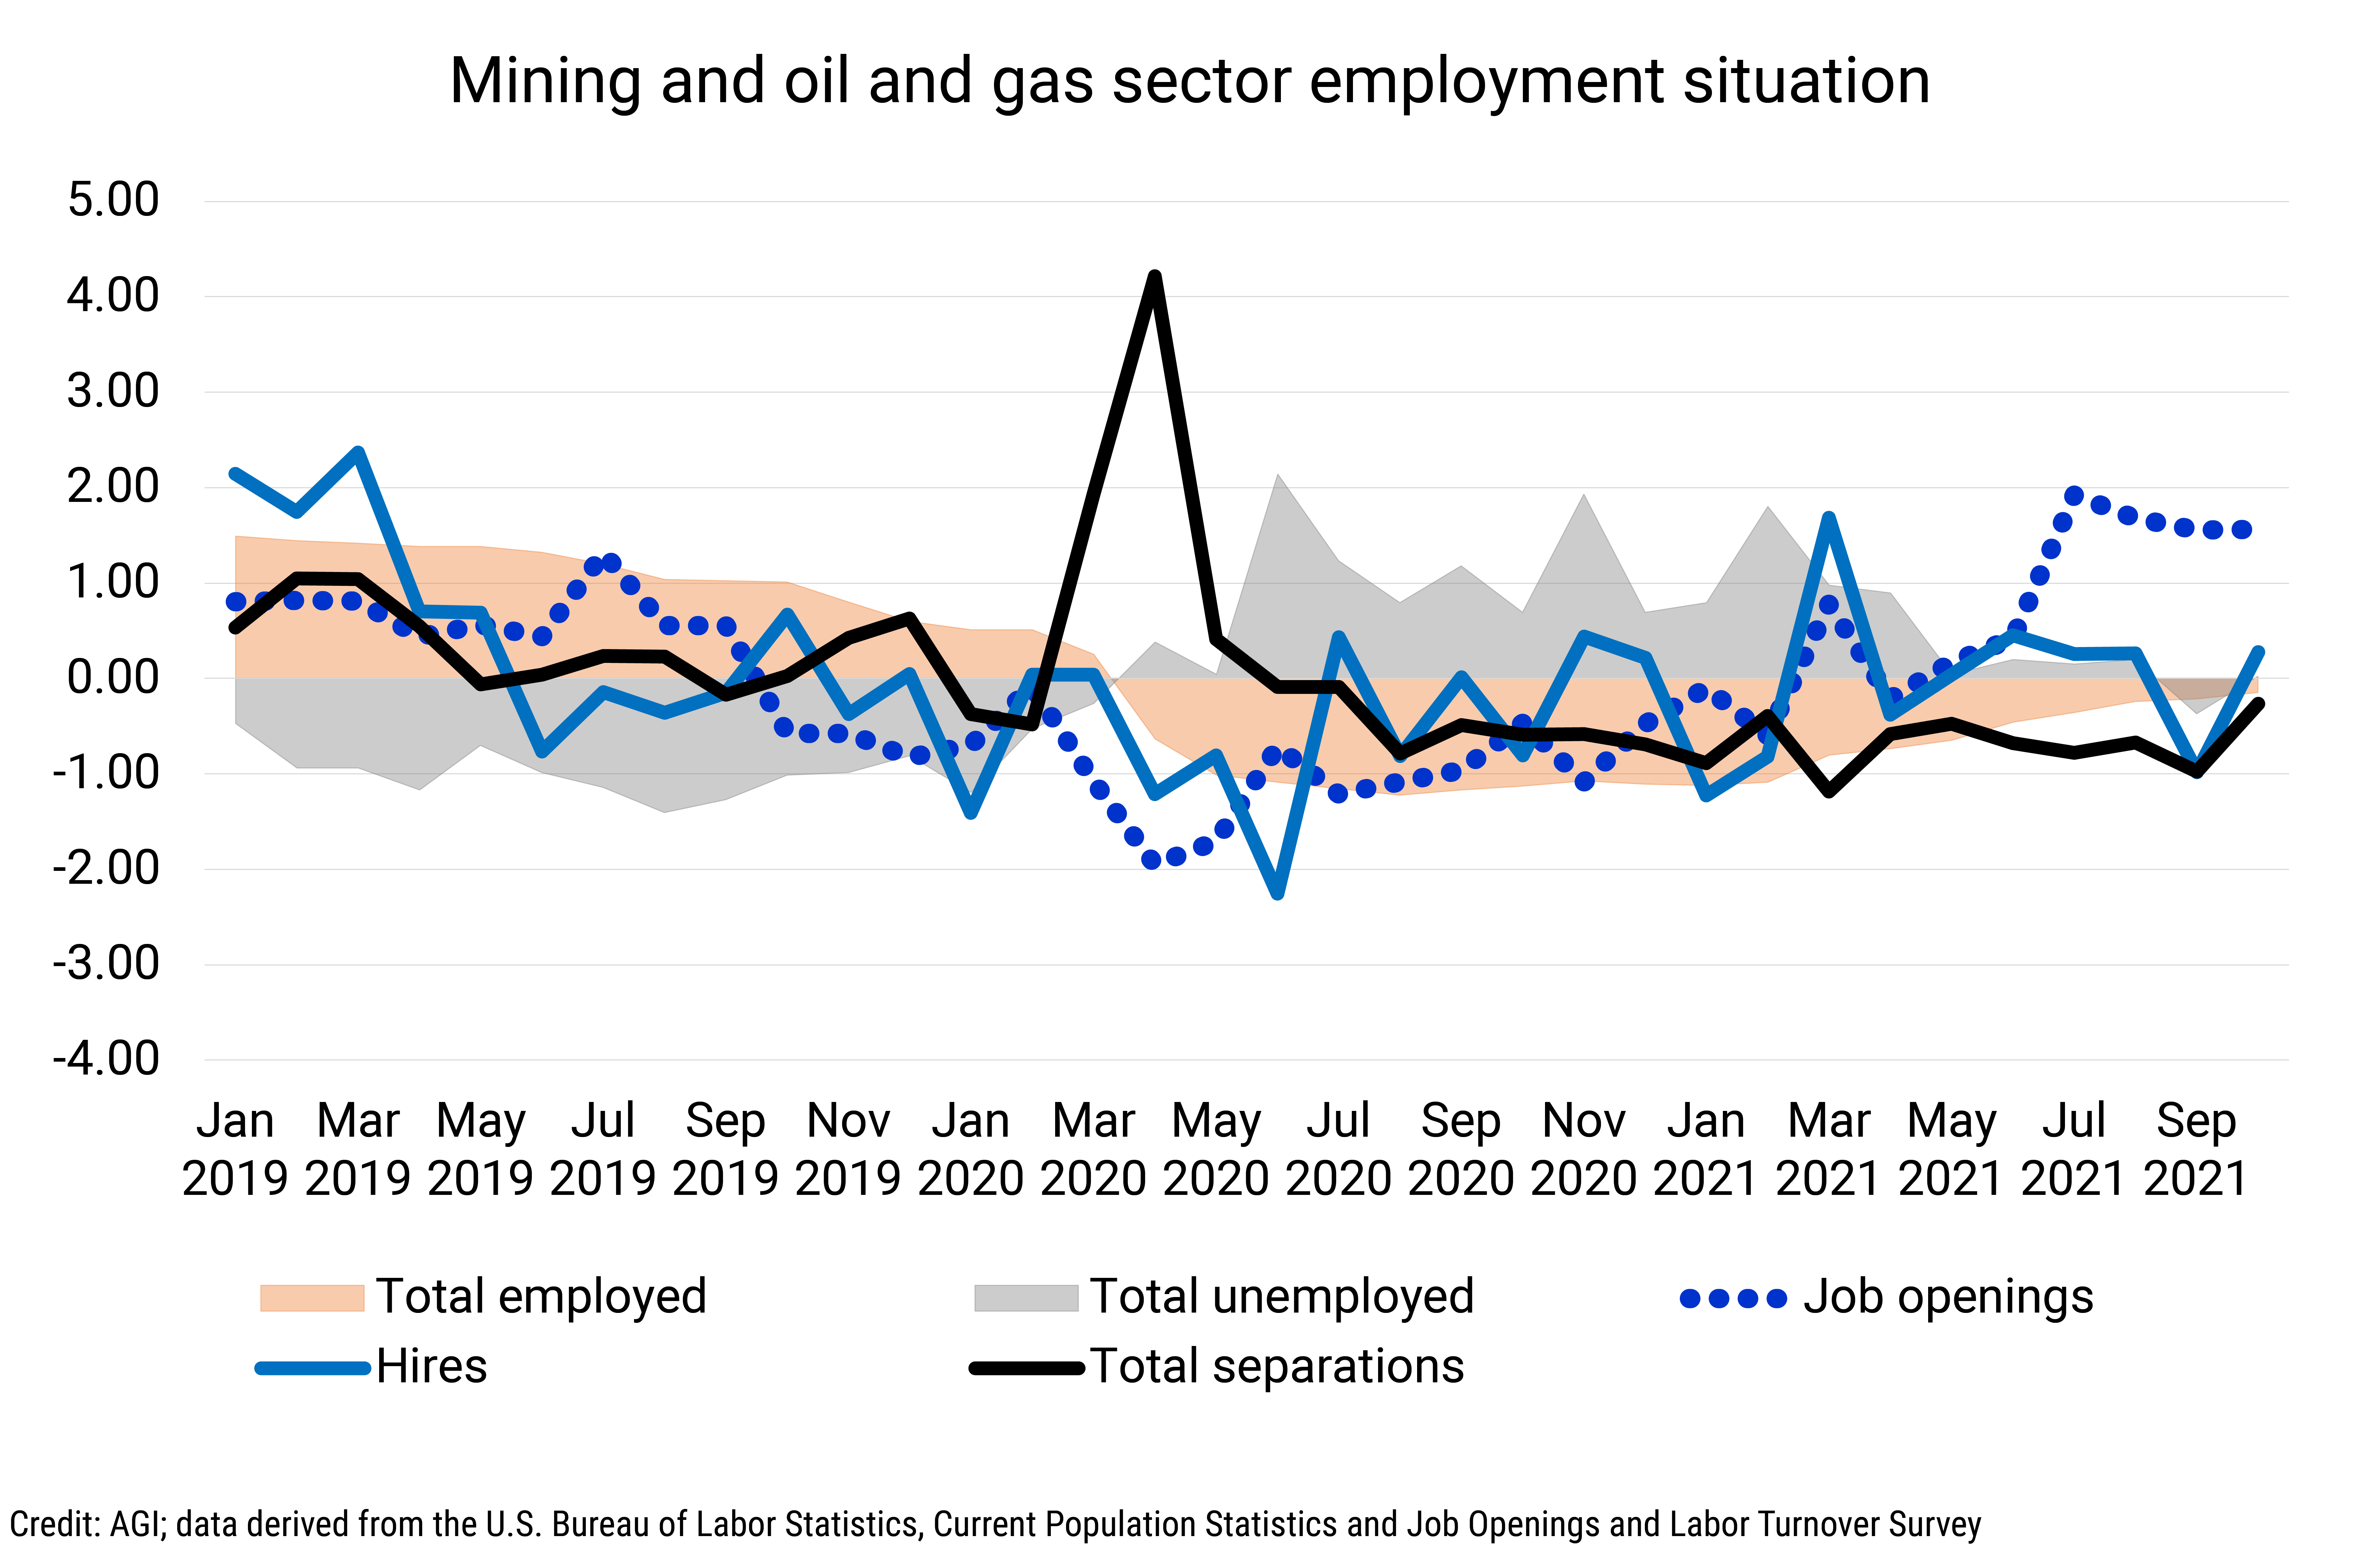
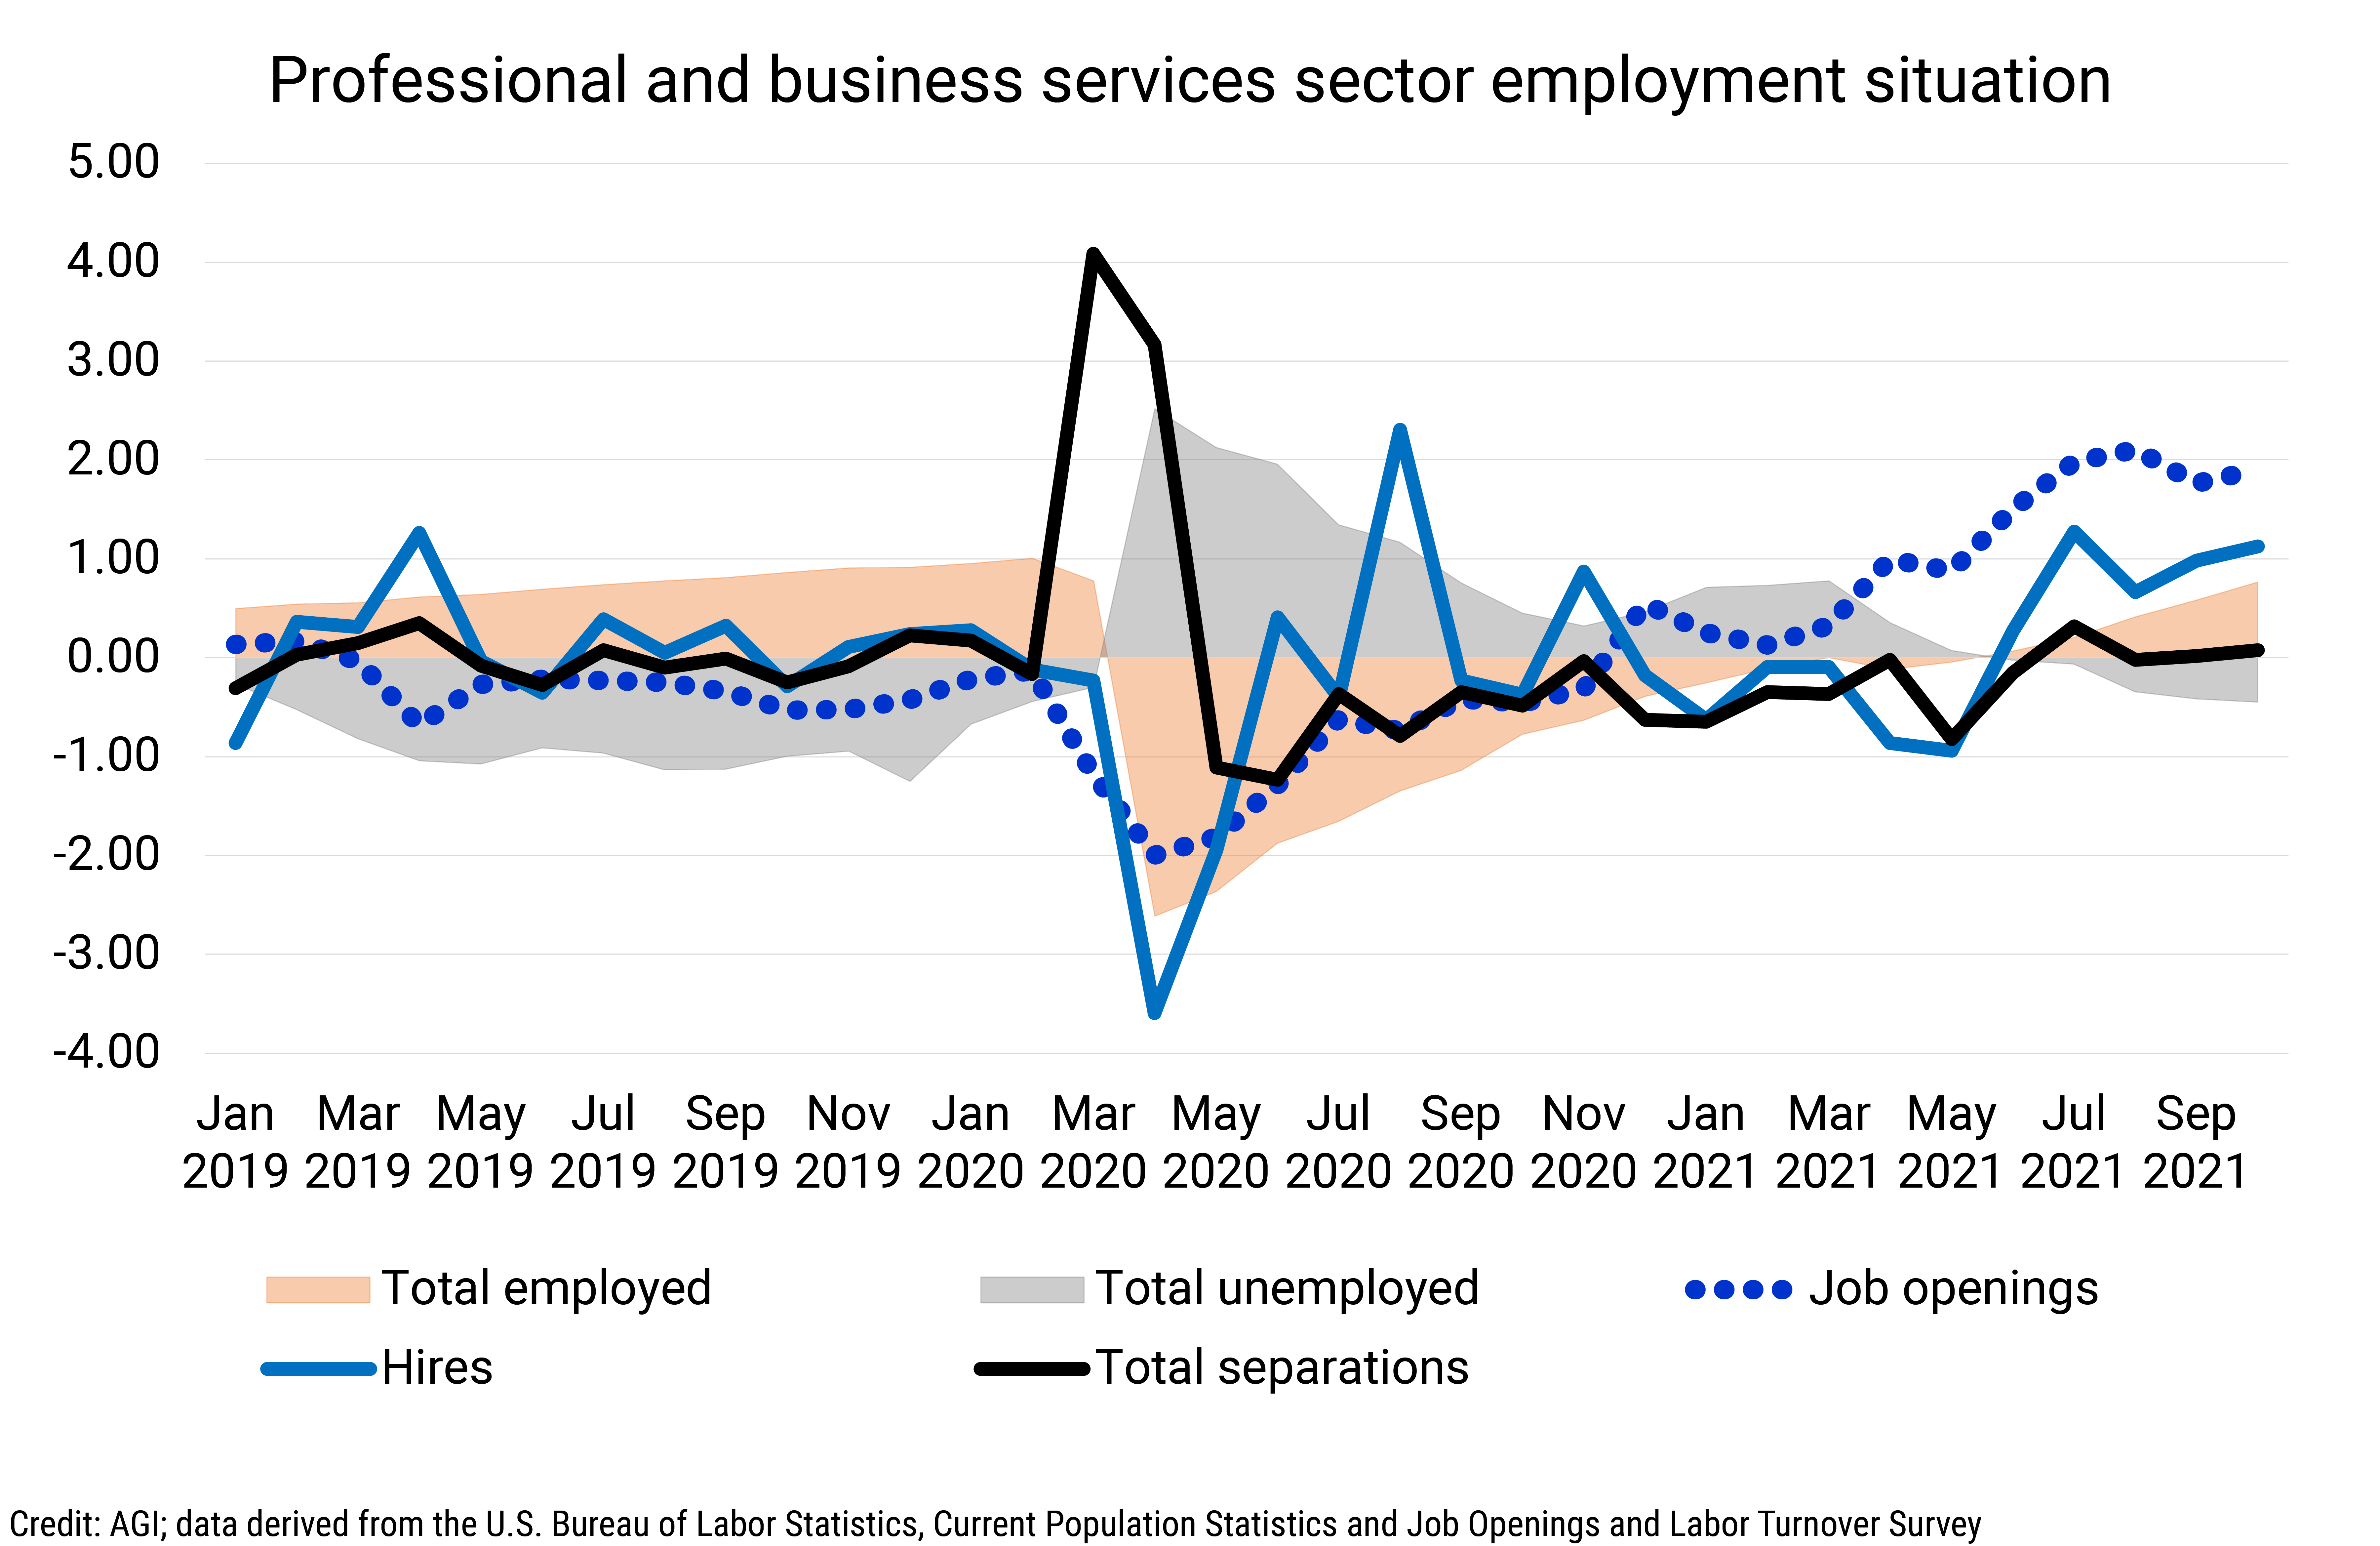
We normalized the employment data to further examine the dynamics within each sector relative to employment and unemployment activity. While all sectors suffered a large spike in separations in Spring 2020, resilience to buffer against that shock varied greatly between sectors with the mining and oil and gas sector showing the least resiliency and the professional and business services sector showing the most resiliency.
In the mining and oil and gas sector, hiring activity slumped in late 2019 and remained depressed through early 2021, never picking up enough to offset pre-pandemic separations nor the spike in separations during Spring 2020. As such, the sector has yet to recover to pre-pandemic employment / unemployment levels. Total workforce estimates (which include the number of employed and unemployed persons in the sector) indicate an overall decrease of approximately 72,000 workers in the sector since January 2019, with most of the job losses occurring in the support activities for oil and gas sector, whose total workforce contracted over 20% during this period.
In contrast, the professional and business services sector rebounded very quickly from the pandemic-induced unemployment shocks. Leading into the pandemic, the pace of hiring outpaced separations, showing a healthy growing sector. Pandemic-related layoffs and suppression of hiring activity in Spring 2020 was followed by a burst of hiring that began in Summer 2020, and the slight slump in hiring activity in early 2021, was followed by another increase in hiring activity in Summer 2021. The sector showed a return to pre-pandemic employment / unemployment levels by mid-2021.
The educational services sector rebounded slower than the professional and business services sector, with employment dynamics returning to pre-pandemic conditions by Fall 2021. Although there was a quick burst of hiring activity in mid-2020, the 2020-2021 academic year showed a slump in hiring activity, that picked up again in early 2021, with acceleration in Summer 2021.
References
1 https://www.bls.gov/opub/btn/volume-10/comparing-labor-supply-and-demand.htm


