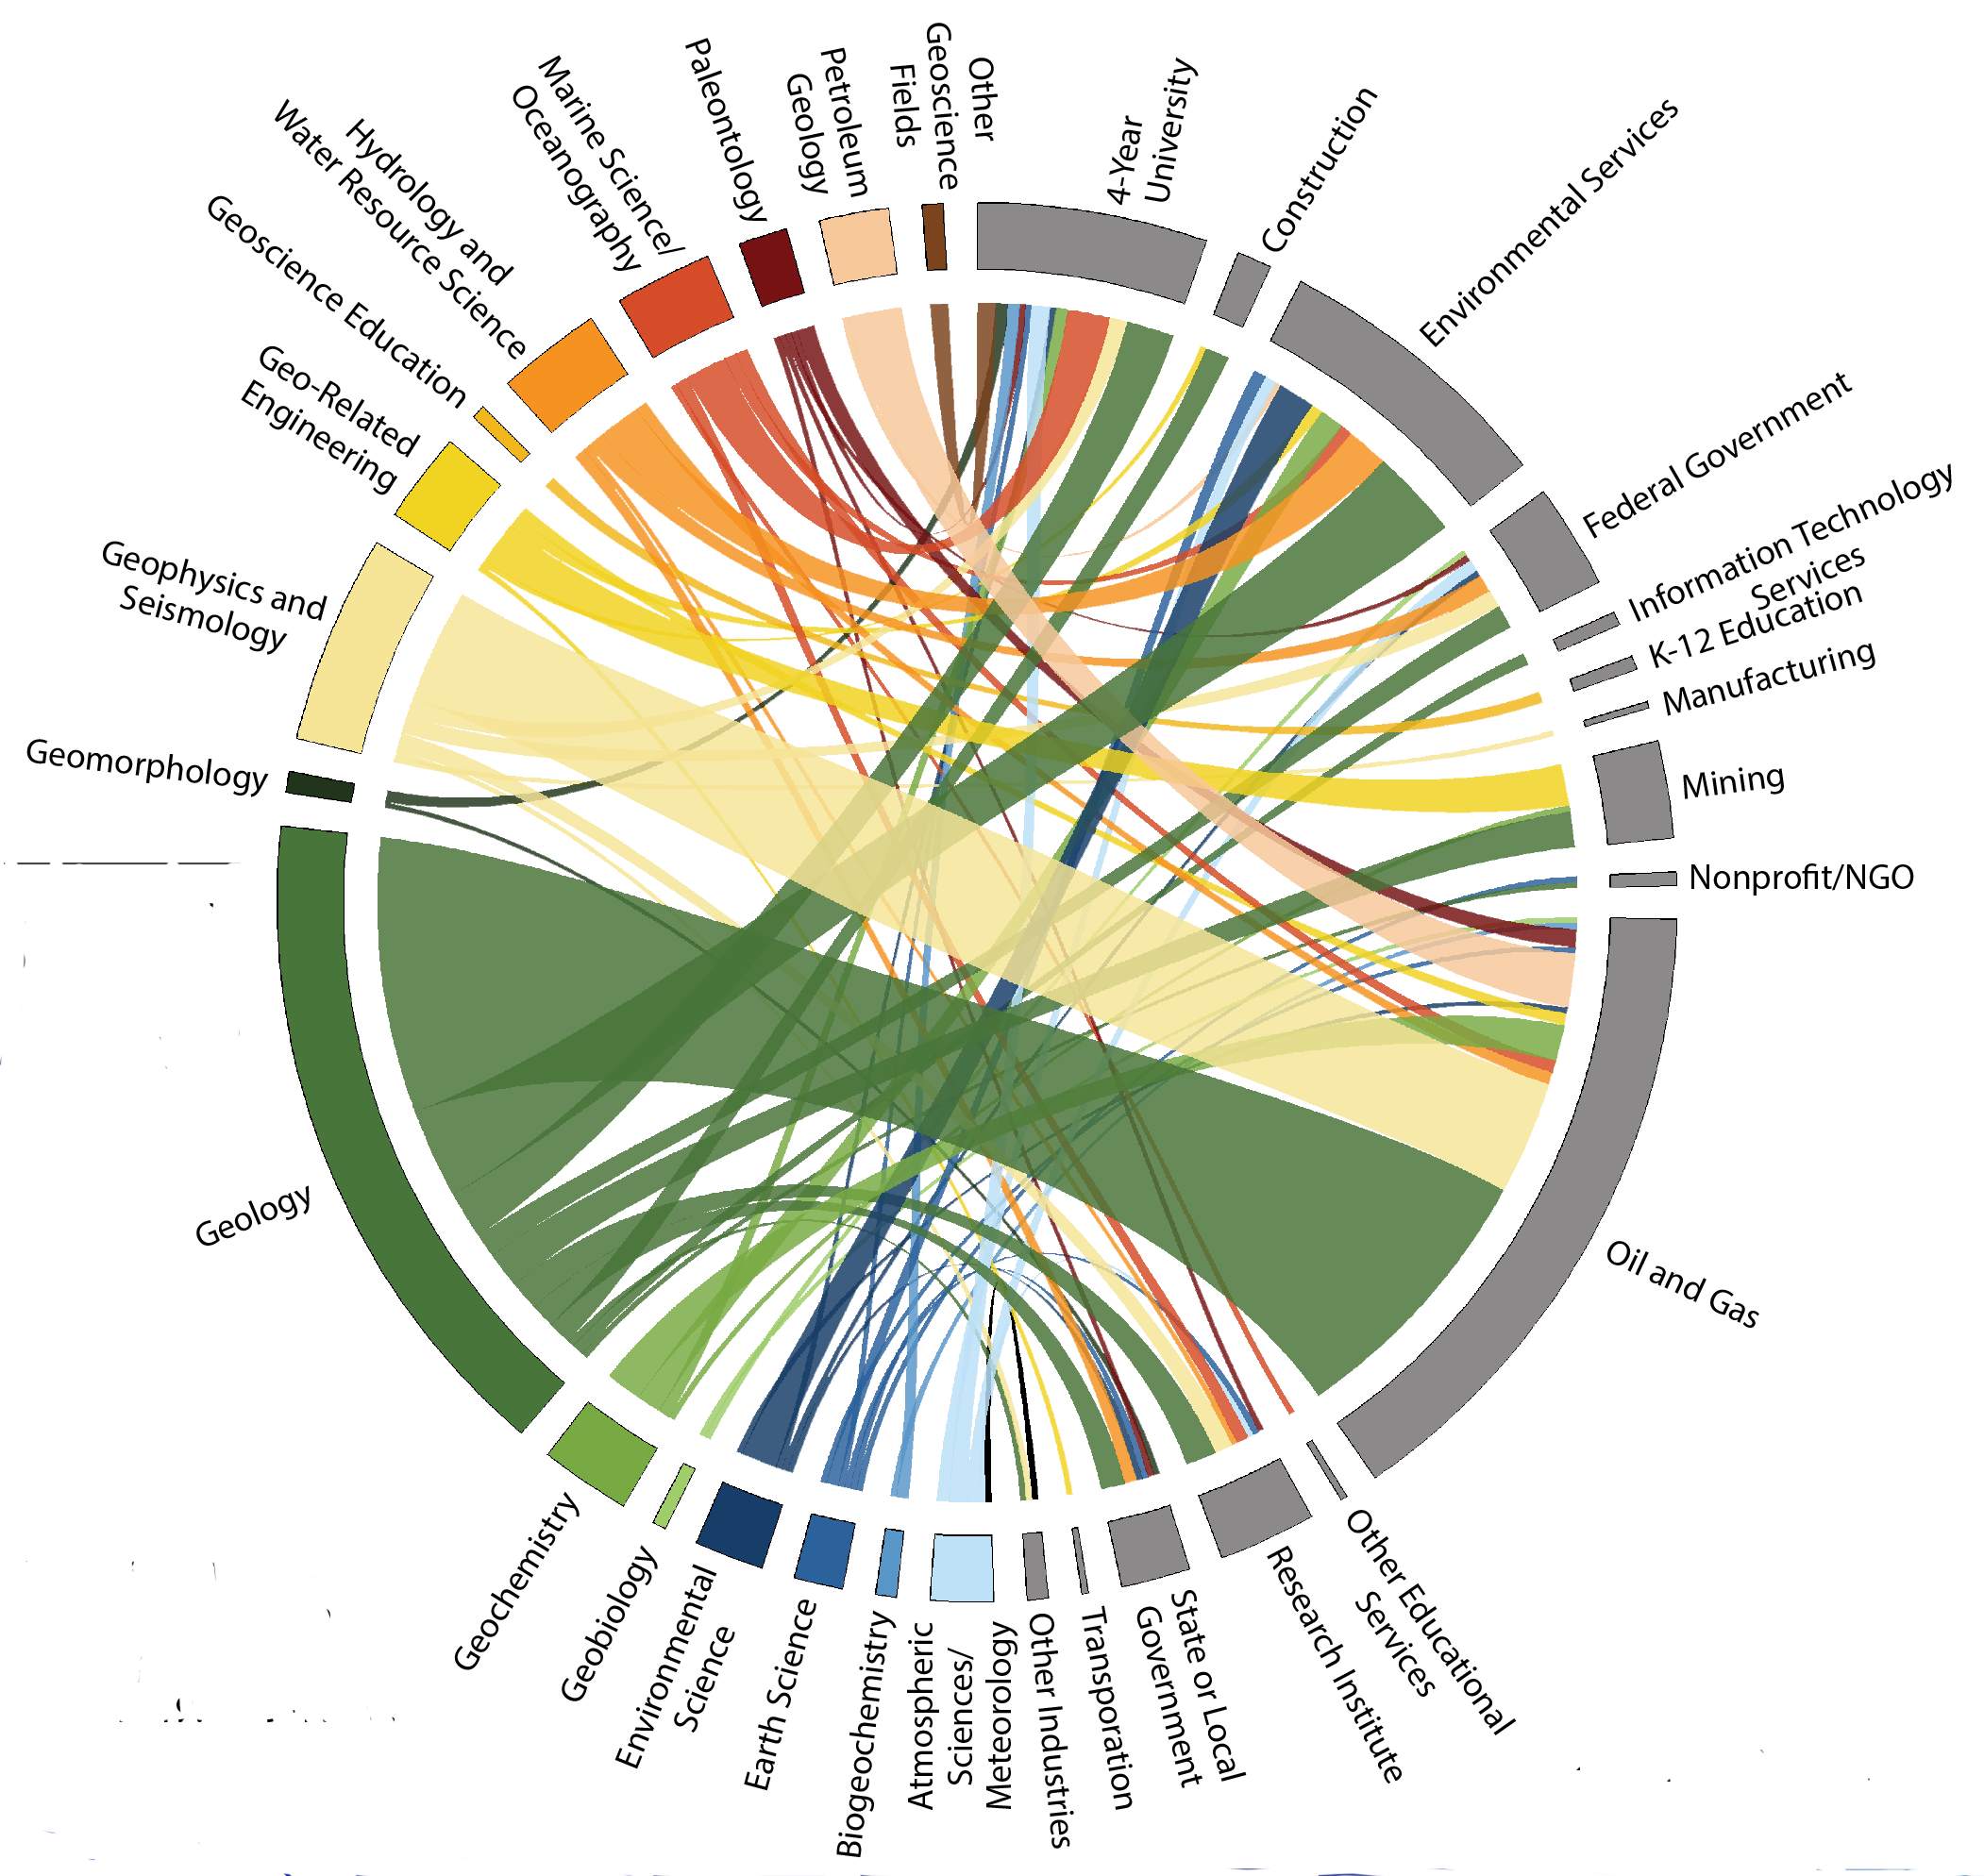
The circular1 diagram below displays the connection between the degree fields of recent geoscience graduates (in color) to the industries where these geoscientists found their first job after graduation (in gray). The size of the bars along the outer edge of the circle represent the number of recent graduates that pursued a particular degree eld and entered a particular industry. Each colored, inner ribbon connects a particular degree field with the various industries where graduates found jobs. The thickness of each ribbon is determined by the number of graduates within each degree field with a job in a particular industry. This visualization shows the variety of industries available to graduates with a geoscience degree, as well as the complexity of the workforce and knowledge needed in the distinct industries.
The data presented here came from the 2013 and 2014 results of AGI’s Geoscience Student Exit Survey. Look forward to the Status of Recent Geoscience Graduates 2014, which will detail the survey results for the 2013-2014 academic year, available in September. The Status of Recent Geoscience Graduates 2013 can be found at https://www.americangeosciences.org/workforce/reports.
1The visualization code was created by M. Krzywinkski (Krzywinski, M. et al. Circos: an Information Aesthetic for Comparative Genomics. Genome Res (2009) 19:1639-1645).
Industries of geoscience graduates' first jobs by degree field. Source: AGI's Geoscience Workforce Program.


