Landslide hazard maps based on geologic maps are a tool for local government officials, planners, developers, engineers, insurance companies, lending institutions, and landowners to assess the risk and take appropriate actions.
Defining the Problem
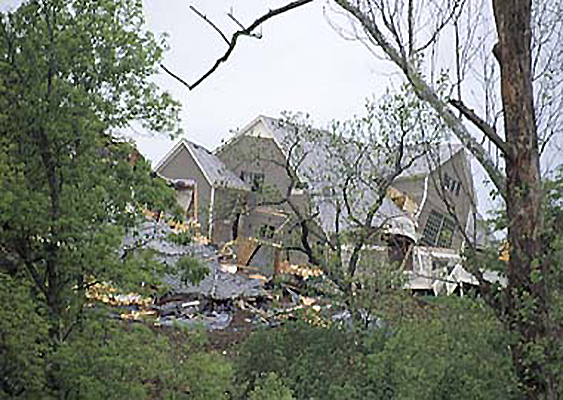
Damaging landslides occur even in vertically challenged states like Kansas (Fig. 1). It is important to be able to delineate landslide hazard areas in order to develop appropriate land-use plans. In Leavenworth County, Kansas, geologic maps combined with maps of landslide features and slope steepness were used to predict landslide hazards and guide land management.
Figure 1: A 1995 landslide in Overland Park, Kansas, destroyed two homes and damaged four lots. Credit: Kansas Geological Survey
The Geologic Map
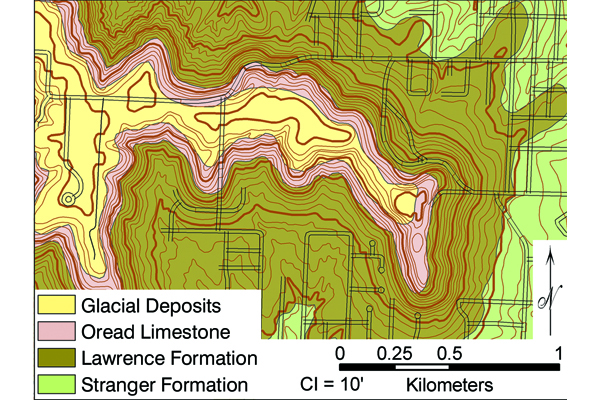
The geologic map of Leavenworth County (Fig. 2) shows the surface distribution of Quaternary glacial deposits and Pennsylvanian bedrock. The glacial deposits, a loose mixture of glacially transported clay- through boulder-sized fragments, cover many upland areas. Below the glacial deposits, the Oread Limestone is a relatively strong unit that supports hilltops. Much of the city of Leavenworth, however, is developed on the weaker shales, siltstones, and sandstones of the Lawrence and Stranger formations, which underlie the Oread Limestone.
Figure 2: Part of the geologic map of Leavenworth County, Kansas. Leavenworth County is in the Kansas City metropolitan area. Credit: McCauley (1998)
Applying the Geologic Map
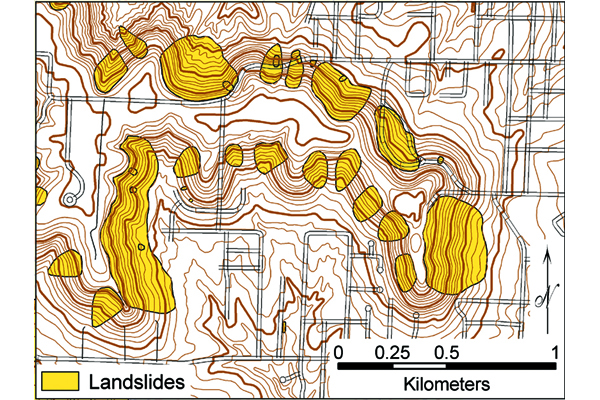
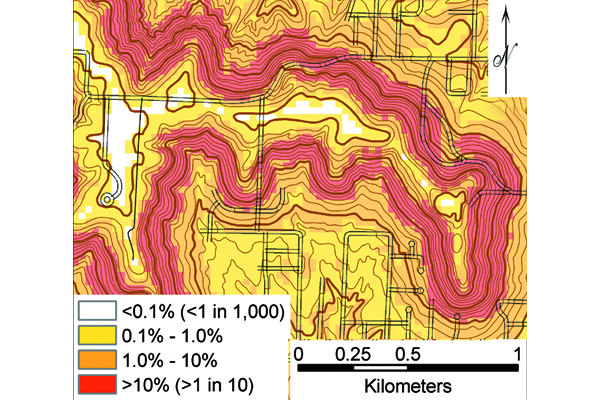
Gravity, weak soil and rock, steeply sloping ground, and water-saturated soil and rock are the basic causes of landslides. Because the local soils develop from weathering of bedrock, a geologic map is a good indicator of the distribution of soil properties. The Lawrence and Stranger formations contain shale layers that readily break down to form unstable, clay-rich soils that are very susceptible to landslides. The Oread Limestone, which consists of interbedded limestone and shale layers, is the next most susceptible unit. The glacial deposits are the least susceptible to land sliding. A statistical analysis that takes into account slope steepness, bedrock geology, and the distribution of previous landslides (Fig. 3) enables a landslide-hazard map to be developed (Fig. 4).
Figure 3 (top): A map showing landslides in a portion of the city of Leavenworth. Credit: Adapted from Olmacher, (2003)
Figure 4 (bottom): This map of a portion of the city of Leavenworth shows the probability of a future landslide given the slope steepness and bedrock geology. Areas shown in red have a greater than 1 in 10 chance of a landslide. Credit: Olmacher and Davis (2003)
Conclusion
The risk of landslides is great in many areas of the Midcontinent. The statistical approach used for this study evaluates the relative stability of slopes by relating previous landslides to the slope steepness and bedrock geology. The analysis shows that slope steepness is the primary factor determining slope stability, but bedrock geology and geologic maps also provide important information on the landslide susceptibility of soil and rock. Landslide hazard maps based on geologic maps are a tool for local government officials, planners, developers, engineers, insurance companies, lending institutions, and landowners to assess the risk and take appropriate actions.
Additional Information
Case study authors: Gregory C. Ohlmacher (Kansas Geological Survey), James R. McCauley (Kansas Geological Survey), and John C. Davis (Davis Consultants, Inc.)
Case study from: Thomas, W.A. 2004. Meeting Challenges with Geologic Maps, p. 34-35. Published by the American Geosciences Institute Environmental Awareness Series. Click here to download the full handbook.

