Geologic mapping provides the data foundation that makes soil mapping and earthquake simulations possible. This approach also can be used to predict damage in areas where the historical record indicates a risk of potential earthquakes.
Defining the Problem
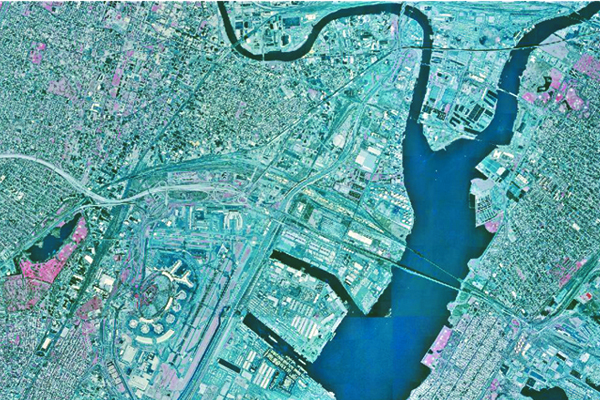
The density and value of its buildings place New Jersey tenth among all states for potential economic loss from earthquakes (Fig. 1) [as of 2005]1. Soft soils amplify the motion of earthquake waves, producing greater ground shaking and increasing the stresses on structures. Loose, wet, sandy soils may lose strength and flow as a fluid when shaken (a process known as liquefaction), causing foundations and underground structures to shift and break. Understanding the shaking and liquefaction potential of soils is an essential component in predicting earthquake damage.
Figure 1: Densely built urban areas on soft soils are prone to earthquake damage. Geologic maps provide vital information on the extent of these soils. Credit: N.J. Department of Environmental Protection
The Geologic Map
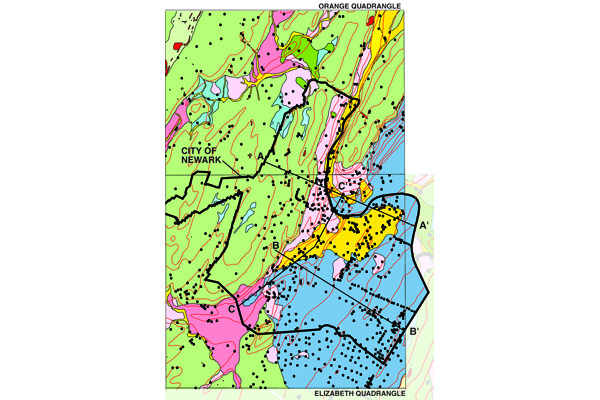
Newark, New Jersey's largest city, is built on glacial and postglacial deposits that overlie sandstone bedrock (Fig. 2)2. Geologic data acquired during the mapping of these deposits include soil observations, records of more than 800 borings and wells, and archival maps of the extent of swamps and salt marshes prior to land filling in the early 20th century. These data permit mapping of the bedrock surface, the thickness and layering of the glacial deposits, and the extent of swamp and salt-marsh peats that are now completely covered by fill.
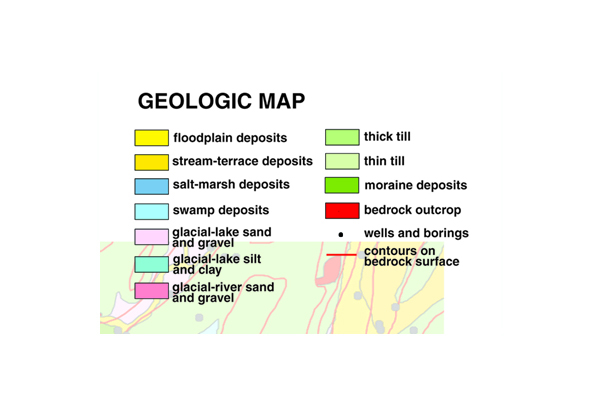
Figure 2: Different soil materials have different potentials for ground-shaking and liquefaction. Unsorted glacial deposits, till, (light green); soft, saturated soils (blue and gold); sand and gravel deposits (pink). Credit: N.J. Geological Survey
Applying the Geologic Map
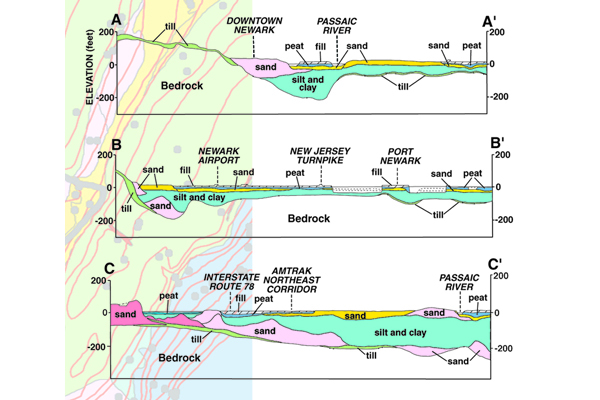
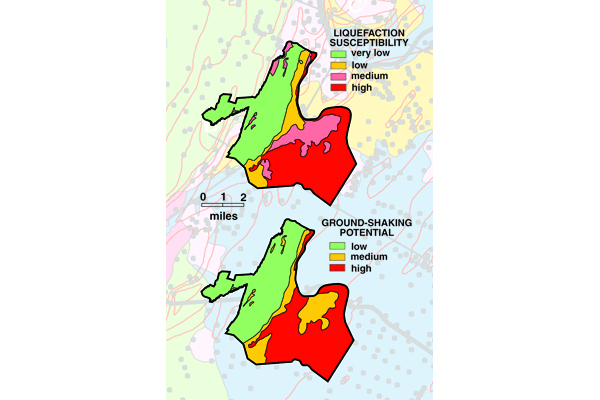
The soft, saturated soils that underlie much of the eastern half of the city are highly susceptible to shaking and liquefaction (Fig. 3)3. Unsorted glacial deposits, till, (light green) has low liquefaction and ground-shaking potential. The soft, saturated soils (blue and gold) under much of the eastern half of the city are highly susceptible to shaking and flowing as a fluid. The narrow belt of sand and gravel deposits (pink) through the center of the city is of intermediate compaction and has medium shaking and liquefaction potential. A simulation for a magnitude 5.5 earthquake centered about 5 miles northwest of the city center was run with these data (Fig. 4)4. Earthquakes of similar magnitude occurred in this area in 1737 and 1884. Less than 10% of buildings underlain by till (unsorted glacial deposits) were significantly damaged, whereas between 20 and 30% of those underlain by wetland and glacial-lake deposits were significantly damaged. The vulnerable eastern section of the city includes vital transportation links, including Newark Airport, the New Jersey Turnpike, Interstate 78, the Amtrak Northeast Corridor rail line, and the Port Newark marine terminal. The mapping and simulations indicate that this is a priority area for strengthening vulnerable structures.
Figure 3 (top): Soft soils amplify the motion of earthquake waves, producing greater ground shaking and increasing the stresses on structures. Loose, wet, sandy soils may lose strength and flow as a fluid when shaken (liquefaction). Credit: S. Stanford
Figure 4 (bottom): A computer model commissioned by the Federal Emergency Management Agency and now used as a nationwide standard analyzes earthquake factors on a census-tract basis to generate damage estimates. Credit: N.J. Geological Survey
Conclusion
Similar soil mapping and earthquake simulations have been completed for four counties, and are planned for eight others in northern New Jersey [information as of 2005, now likely to be significantly more advanced] . Geologic mapping provides the data foundation that makes these simulations possible. This approach also can be used to predict damage in areas where the historical record indicates a risk of potential earthquakes.
References
1N.J. Department of Environmental Protection 2005
2N.J. Geological Survey Open-File Maps OFM 41 and OFM 42, 2002
3S. Stanford, “Geologic Map Guides Earthquake Damage Prediction” in Thomas, W.A. 2004. Meeting Challenges with Geologic Maps, p. 42-43.
4N.J. Geological Survey, Earthquake Loss Estimation Study for Essex County, New Jersey, 2001
Additional Information
Case study author: Scott D. Stanford (New Jersey Geological Survey)
Case study from: Thomas, W.A. 2004. Meeting Challenges with Geologic Maps, p. 42-43. Published by the American Geosciences Institute Environmental Awareness Series. Click here to download the full handbook.


