How do we know?
Climate Science 101
Climate is the average of weather conditions over several decades.1,2 Geoscientists monitor modern climate conditions (1880 A.D. to present) in part by taking direct measurements of weather data (i.e., air temperature, rainfall and snowfall, wind speed, cloudiness, and so on) and averaging those over at least a 30 year period.1,2,3 Because climate conditions affect and are affected by other parts of the Earth system, many additional aspects including atmospheric composition, ocean temperatures, sea level, and glacier size are also tracked to gain a better understanding of how climate interacts with the geosphere.3 Geoscientists also estimate changes in past climate – before direct measurements were possible – from records like tree rings, ice cores, lake and marine sediment cores, and fossils.4,5 Through analysis of many independent types of data, comparisons with past climate records, and climate computer model simulations, geoscientists have concluded that climate is currently changing towards warmer conditions globally, with different regions changing at different rates.
Figure 1: Indicators of a warming world, measured over the last century.11 White arrows indicate increasing trends, and black arrows indicate decreasing trends. Image credit: National Oceanic and Atmospheric Administration’s (NOAA) National Climatic Data Center
How is climate monitored?
Earth’s climate can be thought of as a large, interconnected system with three main parts –the ocean, landmasses, and atmosphere –that affect each other, even from great distances. A change in one part of the Earth system can exert a strong influence on one or more aspects of the Earth’s climate; for example, very warm ocean temperatures in the tropical Pacific Ocean can influence rainfall patterns around the world during El Niño events. Because Earth’s climate system is large and complex, geoscientists monitor the state of the ocean, land, and atmosphere with many types of instruments, including weather stations on land, buoys in the ocean, weather balloons in the atmosphere, and satellites.3 They measure many features of Earth’s atmosphere, land and oceans, such as temperature, precipitation, ocean salinity, atmospheric greenhouse gas concentrations, growing season length, soil moisture, snow and ice cover, sea ice extent, and even ocean currents.3 By averaging this information over periods of 30 years or more, scientists can see if the climate is changing, and how the different parts of Earth’s systems interact with, influence, and are influenced by Earth’s climate.6
Geoscientists can also estimate the state of Earth’s climate for times before direct measurements were recorded.4,5 Geoscientists use a variety of types of geologic records –such as tree rings, the chemical composition of ice cores, glacier size, presence of certain plants and animals (deduced from fossils and pollen), ocean chemistry, and lake levels –and knowledge of the present-day relationships of those records to temperature, rainfall, and other aspects of Earth’s climate in order to estimate past climatic conditions.4 For example, trees tend to grow very wide rings in warmer, wetter years, and thinner rings in colder, drier years. Geoscientists have calculated how the width of tree rings varies due to changes in temperature and precipitation. Tree ring measurements can then be used to infer what past climate was like where each tree grew.7,8 By comparing many types of records from different areas with each other, geoscientists can estimate past changes in climate over specific regions or even the entire planet, and better understand how Earth’s climate system works over time.4,5,7,8
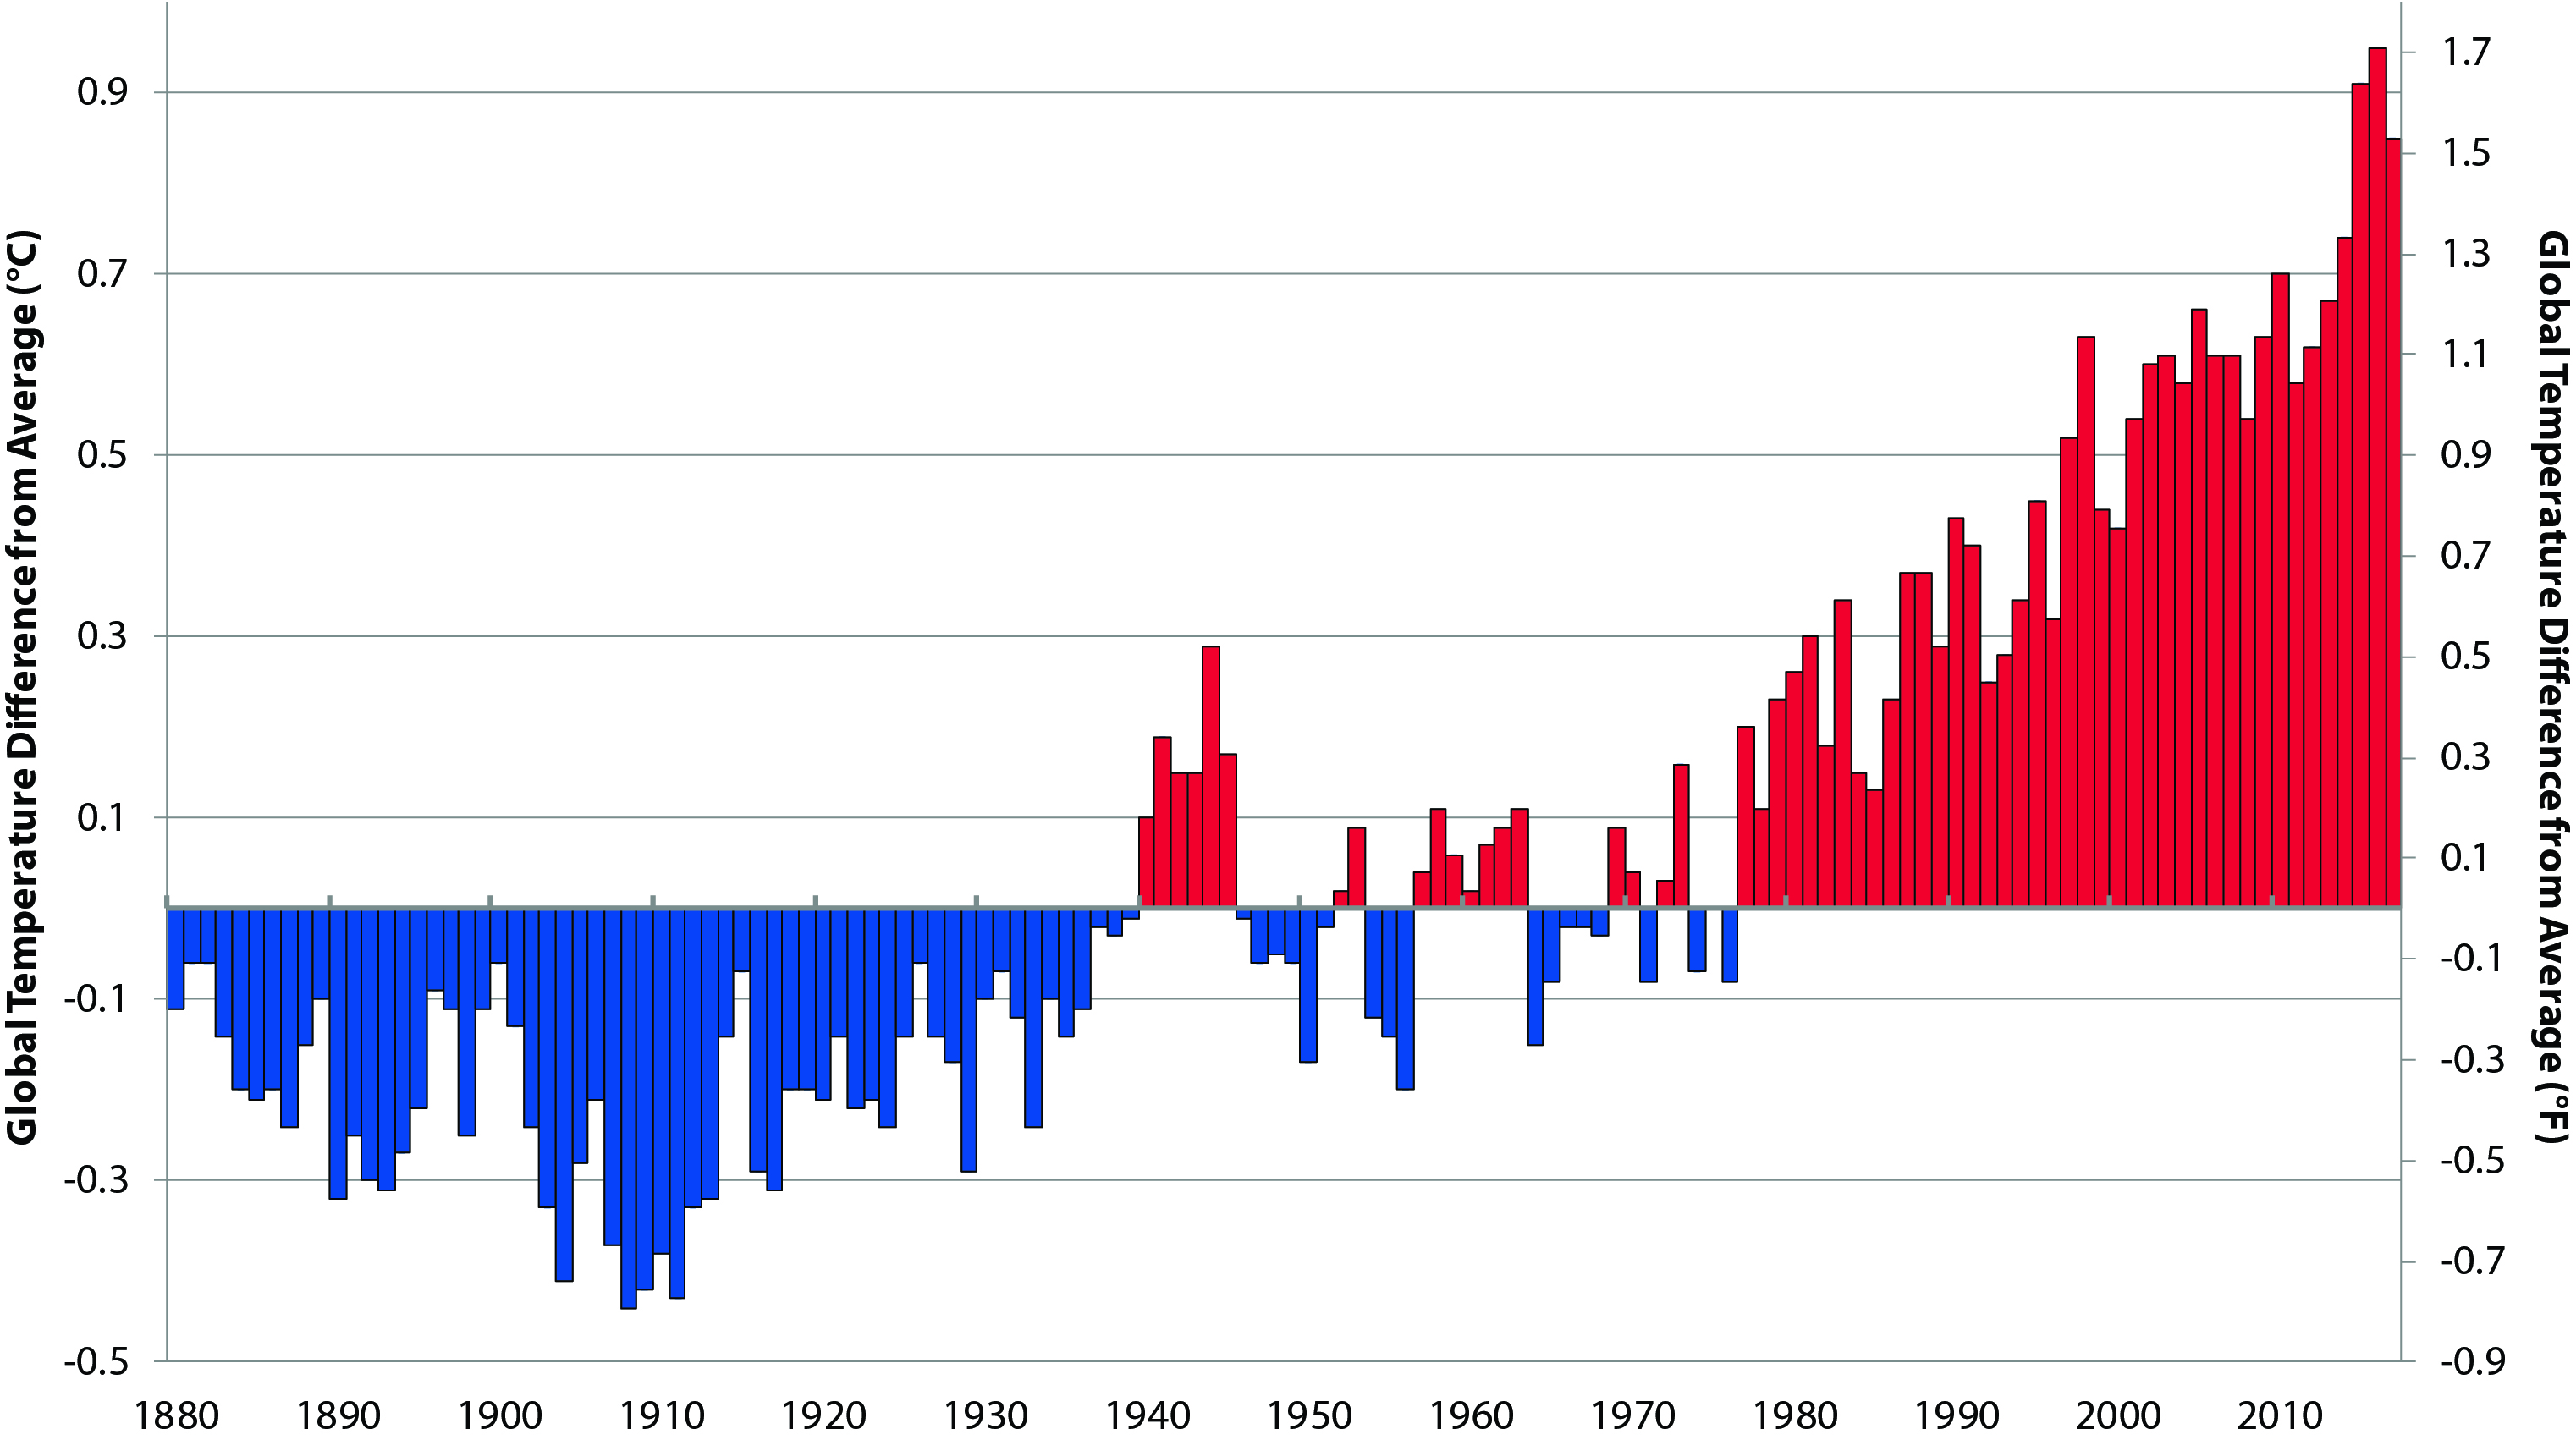
Figure 2: Difference in average global temperature for each year from 1880 – 2016 compared to the 20th century average. Data source: NOAA National Centers for Environmental Information (NCEI).11 Accessed August 23, 2018
What influences past and present-day climate?
By combining direct observations and reconstructions of past climate changes, geoscientists have been able to understand the many natural influences that play a role in Earth’s climate over different time scales, including solar (sun) variability, reflectivity of the Earth’s surface, aspects of Earth’s orbit around the sun, volcanism, ocean temperatures and currents, and greenhouse gas concentrations.8-11 Records from Earth's geologic history show that the climate has changed both gradually and abruptly in the past, and in the last three million years Earth has experienced numerous ice ages separated by short warmer periods.9-11 A full accounting of the influences on climate at different timescales is beyond the scope of this factsheet, but geologic records show that global temperatures and the concentrations of greenhouse gases in the atmosphere have been strongly correlated with each other over the last 800,000 years.9,10 Temperatures have generally risen as the concentrations of greenhouse gases have increased, with unusually rapid increases in both greenhouse gases and air and ocean temperatures occurring in the past 150 years.9-13
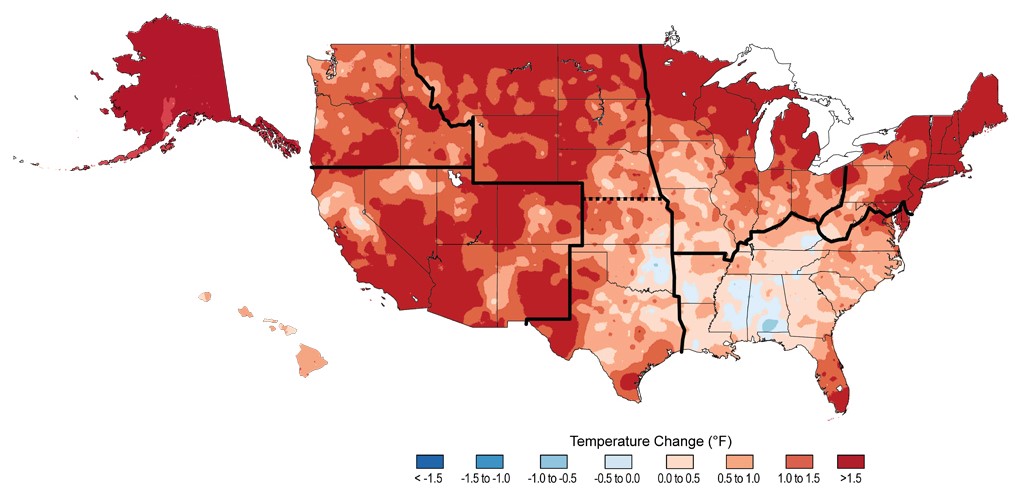
Figure 3: Observed changes in average surface temperature across the United States (Alaska and Hawaii not to scale). Reds indicate warming, blues indicate cooling. Changes are from the 1901-1960 average to the 1991-2012 average for the lower 48 states, and from the 1951 - 1980 average to the 1991-2012 average for Hawaii and Alaska. Image Credit: NOAA NCDC/ Cooperative Institute for Climate and Satellites - NC.11 Accessed August 25, 2017
Recent climate change observations
Observations have shown that global surface temperatures have increased more than 1.5°F (0.8°C) on average since 1880, with both land and the ocean showing increasing temperatures, particularly since the 1970s (see figure above).8,12-16 In the United States, annual average land surface temperatures have risen 1.3°F to 1.9°F since 1895.16 Over 90% of Earth’s warming over the last 50 years has occurred in the ocean, which has a huge capacity to both store and release heat.14,15 The increase in global average temperature since the 19th century is mirrored by increasing atmospheric carbon dioxide concentrations over the same period of time.8,11,15 The average concentration of atmospheric carbon dioxide globally was 405 parts per million in 201717; to put it in context, this level of carbon dioxide in the atmosphere is approximately 45% higher than during any other warm period in the last 400,000 years.10
Other observations of recent climate change include: a global average sea level rise of 8 inches since the late 19th century; declining sea ice, ice sheet, and glacier size; changing patterns in rain and snowfall; decreased snow cover and longer frost-free seasons; and more frequent high-temperature records being set in recent years and decades.8,11,13,15 Contributing factors to sea level rise include the expansion of ocean water as it warms and the melting of glaciers and ice sheets.8,11 Satellite observations have suggested that the rate of sea level rise globally since 1992 has been twice as rapid as during the previous century. 8,11 An additional side-effect from rising carbon dioxide concentrations is that the surface ocean has become approximately 30% more acidic since the late 19th century, which may have strong negative effects on sea life.
Natural processes significantly affect Earth’s climate (this is partly why the trend in Figure 2 is not a smooth one), but there is strong evidence that greenhouse gas emissions from human activities, combined with other human influences such as land-use changes, are linked to the rapid warming that has been observed since the middle of the 20th century.8,11-16,18-20 The ten warmest years since record-keeping began in 1880 have occurred since the early 2000s, and average global temperatures are expected to increase at least 2°F, and perhaps by as much as 11°F, over the next century, along with many other changes in the Earth system.8,14,21,22 Geoscientists are closely monitoring the climate in order to track trends over time and to predict future changes based on natural processes and human activity.
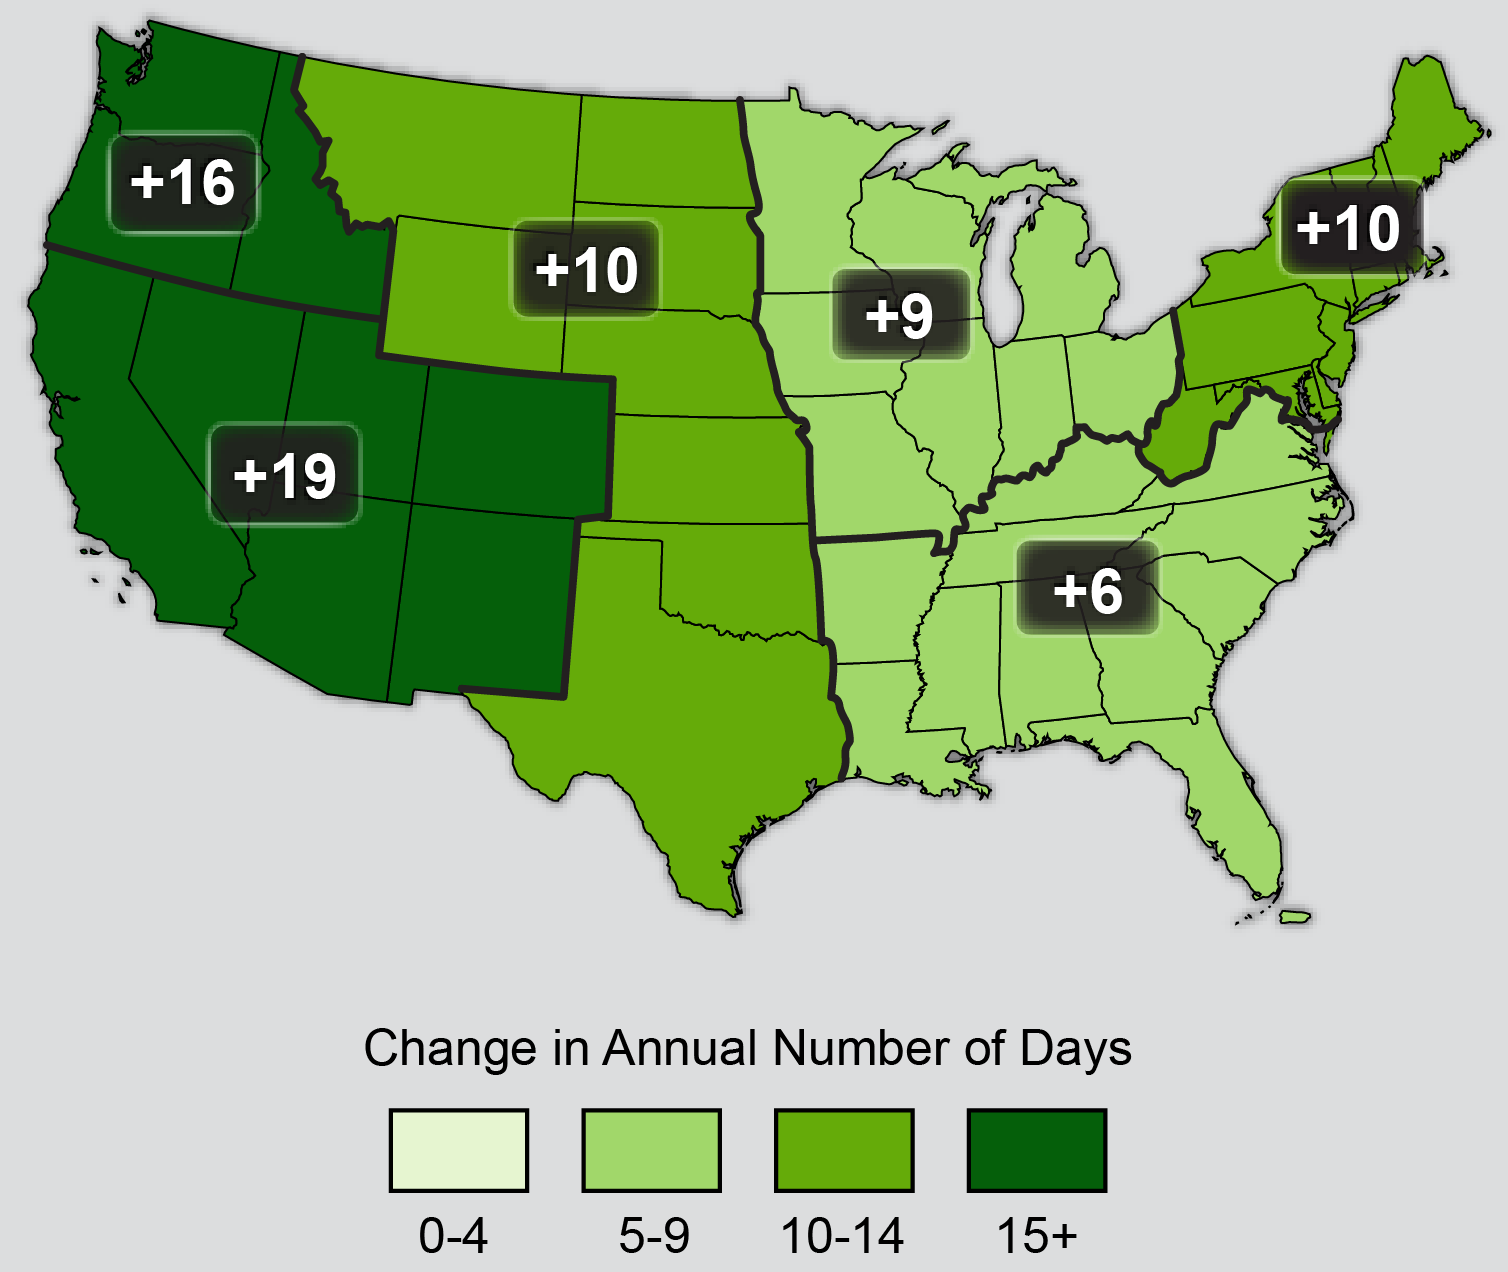
Figure 4: Change in length of frost-free season from the 1901-1960 average to the 1991-2012 average. Image Credit: NOAA NCDC/CICS - NC.11 Accessed August 25, 2017
Just the Numbers
Temperatures8,12-16
- Globally: +1.5°F (0.8°C) on average since 1880
- United States: 1.3°F to 1.9°F on average since 1895
Other Climate Indicators11,14
- Frost-free and growing seasons ~1-3 weeks longer in U.S.
- Global average sea level has risen over 8” since 1880
- Spring snow cover and glacier declines
- Arctic sea ice minimum cover declined >40% since 1978
- Arctic sea ice thickness decreased >50% from 1958-1976 to 2003-2008
- Heavy rainfall events increasing (+30% in Northeast, Midwest, and upper Great Plains)
Atmospheric Carbon Dioxide concentrations17 (ppm: parts per million)
- Average natural range between 400,000 years ago and 1850: 180 – 280 ppm
- Globally, +120 ppm rise since 1850
- Global average in 2017: 405.0 ppm
- Rate of increase: 0.7ppm/year in 1950’s, 2.1 ppm/year between 2003-2013
Key concepts, defined
Climate is the average of weather conditions over at least 30 years.1,2
Greenhouse gases absorb and re-emit infrared radiation emitted by the Earth, reducing the rate at which Earth loses heat to space and thus warming the lower atmosphere. Major greenhouse gases include water vapor, carbon dioxide, and methane.23
Learn More
National Oceanic and Atmospheric Administration (NOAA) – Climate.gov website and climate data portal
NOAA – Basics of the Carbon Cycle and the Greenhouse Effect
U.S. Global Change Research Program (2014) – Climate Change Impacts in the United States: The Third National Climate Assessment
United Nations Intergovernmental Panel on Climate Change (2013) – Fifth Assessment Report, Climate Change 2013: The Physical Science Basis
U.S. Geological Survey – Paleoclimate Research (webpage)
References
1 National Aeronautics and Space Administration (NASA). What’s the difference between weather and climate? (Accessed February 2018)
2 National Snow and Ice Data Center. Climate vs. Weather (Accessed February 2018).
3 Climate.gov, NOAA. How do we observe today's climate? (Accessed February 2018)
4 Climate.gov, NOAA. Past Climate Primer (Accessed February 2018).
5 National Centers for Environmental Information, NOAA. Paleoclimatology Data (Accessed February 2018)
6 Climate.gov, NOAA. How do weather observations become climate data? (Accessed February 2018)
For a complete listing of references, please visit the web version of this case study at www.americangeosciences.org/critical-issues/factsheet/evidence-for-prese...
7 NASA. Tree rings provide snapshots of Earth's past climate (Accessed February 2018).
8 U.N. Intergovernmental Panel on Climate Change (IPCC; 2013). Fifth Assessment Report, Climate Change 2013: The Physical Science Basis
9 IPCC (2007). FAQ: What caused the ice ages and other important climate changes before the Industrial Era? (Accessed June 2019).
10 National Centers for Environmental Information, NOAA. Temperature change and carbon dioxide change (Accessed February 2018).
11 U.S. Global Change Research Program (USGCRP; 2014). Third National Climate Assessment: Observed Change.
12 NASA. Climate Change Facts: Causes (Accessed February 2018).
13 NASA. Climate change: How do we know? (Accessed February 2018)
14 NOAA. FAQ: Is the globe still warming today? (Accessed February 2018)
15 NOAA. Global Climate Change Indicators (Accessed June 2019).
16 USGCRP (2014). Third National Climate Assessment: Recent U.S. Temperature Trends.
17 Earth Systems Research Laboratory, NOAA. Trends in atmospheric carbon dioxide (Accessed February 2018).
18 USGCRP (2014). Third National Climate Assessment: Land Use and Land Cover Change.
19 U.S. Geological Survey. FAQ: How do changes in climate and land use relate to one another? (Accessed February 2018)
20 NASA. Aerosols: Tiny Particles, Big Impact (Accessed February 2018).
21 USGCRP (2014). Third National Climate Assessment: Future Climate Change.
22 National Academies of Sciences, Engineering, and Medicine (2010). Advancing the Science of Climate Change (Report).
23 NOAA. Basics of the Carbon Cycle and the Greenhouse Effect (Accessed August 2018).

This work is licensed under a Creative Commons Attribution-NonCommercial-NoDerivatives 4.0 International License.
You are free to share or distribute this material for non-commercial purposes as long as it retains this licensing information, and attribution is given to the American Geosciences Institute.


