
Download a full PDF of Petroleum and the Environment (free) or purchase a printed version ($19.99).
Other parts in this series:
1. Petroleum and the Environment: an Introduction
2. Water in the Oil and Gas Industry
3. Induced Seismicity from Oil and Gas Operations
4. Water Sources for Hydraulic Fracturing
5. Using Produced Water
6. Groundwater Protection in Oil and Gas Production
7. Abandoned Wells
8. What Determines the Location of a Well?
9. Land Use in the Oil and Gas Industry
10. The Pinedale Gas Field, Wyoming
11. Heavy Oil
12. Oil and Gas in the U.S. Arctic
13. Offshore Oil and Gas
14. Spills in Oil and Natural Gas Fields
15. Transportation of Oil, Gas, and Refined Products
16. Oil Refining and Gas Processing
17. Non-Fuel Products of Oil and Gas
18. Air Quality Impacts of Oil and Gas
19. Methane Emissions in the Oil and Gas Industry
20. Mitigating and Regulating Methane Emissions
21. Regulation of Oil and Gas Operations
22. Health and Safety in Oil and Gas Extraction
23. Subsurface Data in the Oil and Gas Industry
24. Geoscientists in Petroleum and the Environment
Glossary of Terms
References
On this page you will find the full listing of references for Petroleum and the Environment (2018)
Part 1: Petroleum and the Environment: An Introduction
1 U.S. Energy Information Administration – U.S. Energy Facts Explained.
2 International Energy Agency (2017). Key world energy statistics, 2017.
3 U.S. Energy Information Administration (2018). Annual Energy Outlook 2018.
4 U.S. Energy Information Administration (2012). Energy Perspectives 1949-2011.
5 U.S. Energy Information Administration – Monthly Energy Review.
6 U.S. Energy Information Administration – Natural Gas Gross Withdrawals and Production.
7 U.S. Energy Information Administration – Crude Oil Production.
8 U.S. Pipeline and Hazardous Materials Safety Administration – Data and Statistics Overview.
9 U.S. Energy Information Administration – Petroleum & Other Liquids: Exports.
10 National Oceanic and Atmospheric Administration – Climate change impacts.
11 NASA – The consequences of climate change.
12 U.S. Environmental Protection Agency – Global Greenhouse Gas Emissions Data.
13 U.S. Environmental Protection Agency – Assessment of the Potential Impacts of Hydraulic Fracturing for Oil and Gas on Drinking Water Resources.
14 National Research Council (2013). Induced Seismicity Potential in Energy Technologies. Washington, DC: The National Academies Press.
15 Foulger, G et al. (2017). Global review of human-induced earthquakes. Earth-Science Reviews, 178, 438-514.
16 U.S. Geological Survey – Induced Earthquakes: Myths and Misconceptions.
17 Atkinson, G.M. et al. (2016). Hydraulic Fracturing and Seismicity in the Western Canada Sedimentary Basin. Seismological Research Letters 87(3), 631-647.
18 American Geosciences Institute (2017). State Responses to Induced Earthquakes.
19 U.S. Energy Information Administration – What is U.S. electricity generation by energy source?
20“Steamflooding Keeps California Field Producing 117 Years Later.” S. Weeden, E&P Magazine, April 1, 2016.
21 U.S. Pipeline and Hazardous Materials Safety Administration – Incident Statistics.
Part 2: Water in the Oil and Gas Industry
1 Maupin, M.A. et al. (2014). Estimated Water Use in the United States in 2010. U.S. Geological Survey Circular 1405.
2 U.S. Geological Survey - How much water does the typical hydraulically fractured well require?
3 Veil, J. (2015). U.S. Produced Water Volumes and Management Practices in 2012
4 National Academies of Science, Engineering, and Medicine (2017). Flowback and Produced Waters: Opportunities and Challenges for Innovation: Proceedings of a Workshop. Washington DC: The National Academies Press.
5 U.S. Geological Survey - Wastewater Disposal Facility in Colorado.
6 Scanlon, BR, et al. (2014). Comparison of Water Use for Hydraulic Fracturing for Unconventional Oil and Gas versus Conventional Oil. Environ. Sci. Technol., 48, 12386-12393.
7 Clark, C.E. et al. (2013). Life Cycle Water Consumption for Shale Gas and Conventional Natural Gas. Environ. Sci. Technol., 47, 11829-11836.
Part 3: Induced Seismicity from Oil and Gas Operations
1 National Research Council (2013). Induced Seismicity Potential in Energy Technologies.
2 Nicholson, C. and Wesson, R.L. (1990). Earthquake Hazard Associated with Deep Well Injection – A Report to the U.S. Environmental Protection Agency. U.S. Geological Survey Bulletin 1951.
3 American Geosciences Institute (2017). State Responses to Induced Seismicity.
4 Atkinson, G. et al. (2016). Hydraulic Fracturing and Seismicity in the Western Canada Sedimentary Basin. Seismological Research Letters, 87(3), 631-647.
5 U.S. Geological Survey – Induced Earthquakes: Overview.
6 Veil, J. (2015). U.S. Produced Water Volumes and Management Practices in 2012.
7 U.S. Geological Survey – Do all wastewater disposal wells induce earthquakes?
8 U.S. Geological Survey (2017) – Short-term Induced Seismicity Models.
9 U.S. Geological Survey - Earthquake Catalog.
10 U.S. Geological Survey – House Damage from 2011 Oklahoma Earthquake.
11 Kansas Geological Survey (2017). Update on Kansas Seismicity: A Year of Change, What Does it Mean?
12 Kansas Geological Survey (2018). Number of Earthquakes Each Month, 2013 to Date.
13 Frohlich, C. et al. (2016). A Historical Review of Induced Earthquakes in Texas. Seismological Research Letters, 87 (4), 1022-1038.
14 Bao, X. and Eaton, D.W. (2016). Fault activation by hydraulic fracturing in western Canada. Science, 354, 1406-1409.
15 Skoumal, R. et al. (2015). Earthquakes Induced by Hydraulic Fracturing in Poland Township, Ohio. Seismological Society of America Bulletin, 105(1), 189-197.
16 Ground Water Protection Council and Interstate Oil and Gas Compact Commission (2015). Potential Injection-Induced Seismicity Associated with Oil and Gas Development: A Primer on Technical and Regulatory Considerations Informing Risk Management and Mitigation.
17 U.S. Environmental Protection Agency, Underground Injection Control National Technical Workgroup (2015). Minimizing and Managing Potential Impacts of Injection-Induced Seismicity from Class II Disposal Wells: Practical Approaches.
18 Chen, X. et al. (2017). The Pawnee earthquake as a result of the interplay among injection, faults, and foreshocks. Scientific Reports, 7, 4945.
Part 4: Water Sources for Hydraulic Fracturing
1 U.S. Geological Survey Water Availability and Use Science Program, National Brackish Groundwater Assessment – What is Brackish?
2 Maupin, M.A. et al. (2014). Estimated Water Use in the United States in 2010. U.S. Geological Survey Circular 1405.
3 Union of Concerned Scientists (2011). Freshwater Use by U.S. Power Plants. Figure 9 used with permission.
4 U.S. Global Change Research Program (2014). U.S. National Climate Assessment: National Climate Change Impacts in the United States.
5 Gallegos, T.J. et al. (2015). Hydraulic fracturing water use variability in the United States and potential environmental implications. Water Resources Research, 51(7), 5839-5845. Image obtained here.
6 Veil, J. (2015). U.S. Produced Water Volumes and Management Practices in 2012.
7 Energy & Environment Research Center, University of North Dakota (2016). A Review of Bakken Water Management Practices and Potential Outlook.
8 Whitfield, S. (2017). Permian, Bakken Operators Face Produced Water Challenges. Society of Petroleum Engineers.
9 Kondash, A.J. et al. (2017). Quantity of flowback and produced waters from unconventional oil and gas exploration. Science of the Total Environment, 574, 314-321.
10 Vidic, R.D. and Yoxtheimer, D. (2017). Changes in the Quantity and Quality of Produced Water from Appalachian Shale Energy Development and their Implications for Water Reuse. Presentation at the Pennsylvania State University Marcellus Center for Outreach and Research.
11 National Academies of Science, Engineering, and Medicine (2017). Flowback and Produced Waters: Opportunities and Challenges for Innovation: Proceedings of a Workshop. Washington DC: The National Academies Press.
12 Scanlon, B.R. et al. (2014). Will water scarcity in semiarid regions limit hydraulic fracturing of shale plays? Environmental Research Letters, 9, 124011.
13FracFocus Chemical Disclosure Registry.
14 Nicot, J-P. et al. (2011). Current and Projected Water Use in the Texas Mining and Oil and Gas Industry. Bureau of Economic Geology for the Texas Water Development Board, Contract No. 0904830939.
15 Texas Water Development Board – Desalination Facts.
16 American Geosciences Institute (2016). Desalination as a Source of Fresh Water.
17 Society of Petroleum Engineers PetroWiki - Fracturing fluids and additives.
Part 5: Using Produced Water
1 U.S. Geological Survey – National Produced Waters Geochemical Database.
2 Veil, J. (2015). U.S. Produced Water Volumes and Management Practices in 2012.
3 Oklahoma Water Resources Board – Water for 2060 Produced Water Working Group. https://www.owrb.ok.gov/2060/pwwg.php
4 Colorado School of Mines Advanced Water Technology Center – Produced Water Beneficial Use Case Studies.
5 National Academies of Science, Engineering, and Medicine (2017). Flowback and Produced Waters: Opportunities and Challenges for Innovation: Proceedings of a Workshop. Washington DC: The National Academies Press.
6 Railroad Commission of Texas – Injection and Disposal Wells.
7 "PA DEP approved 11th underground injection well for oil and gas waste." J. Hurdle, NPR StateImpact, June 5, 2017.
8 U.S. Environmental Protection Agency – Protecting Underground Sources of Drinking Water from Underground Injection (UIC).
9 Vidic, R.D. and Yoxtheimer, D. (2017). Changes in the Quantity and Quality of Produced Water from Appalachian Shale Energy Development and their Implications for Water Reuse. Presentation at the Pennsylvania State University Marcellus Center for Outreach and Research.
10 Colorado School of Mines Advanced Water Technology Center – Produced Water Beneficial Use Case Studies.
11 National Research Council (2010). Management and Effects of Coalbed Methane Produced Water in the Western United States. Washington, DC: The National Academies Press.
12 California State Water Resources Control Board (2016). Frequently Asked Questions About Recycled Oilfield Water for Crop Irrigation.
13 North Dakota Department of Health – Guidelines for the Use of Oilfield Salt Brines for Dust and Ice Control.
141509.226: Surface applications of brine by local governments. Ohio Revised Code, Title XV: Conservation of Natural Resources, Chapter 1509: Division of Oil and Gas Resources Management – Oil and Gas.
15 Poole, H. (2013). State Policies on Use of Hydraulic Fracturing Waste as a Road Deicer. Connecticut Office of Legislative Research.
16 Schnebele, E. (2016). Iodine. 2015 Minerals Yearbook, U.S. Geological Survey.
Part 6: Groundwater Protection in Oil and Gas Production
1 Maupin, M.A. et al. (2014). Estimated Water Use in the United States in 2010, U.S. Geological Survey Circular 1405.
2 U.S. Geological Survey – The USGS Water Science School: Aquifers and Groundwater.
3 Alley, W.M. et al. (1999). Sustainability of Ground-Water Resources. U.S. Geological Survey Circular 1186.
4 Ressetar, R. (2012). Energy News: Hydraulic Fracturing and Shale Gas. Utah Geological Survey, Survey Notes, 44(2), May 2012.
5 FracFocus Chemical Disclosure Registry – Chemical Use in Hydraulic Fracturing.
6 FracFocus Chemical Disclosure Registry.
7 “DEP: Unauthorized drilling fluid contaminated Potter County Aquifer.” S. Phillips, NPR StateImpact Pennsylvania, October 1, 2015.
8 National Ground Water Association (2013). Water Wells in Proximity to Natural Gas or Oil Development. NGWA Information Brief, updated September 2017.
9 Kell, S. (2011). State Oil and Gas Agency Groundwater Investigations and Their Role in Advancing Regulatory Reforms, A Two State Review: Ohio and Texas. Ground Water Protection Council, August 2011.
10 U.S. Geological Survey – U.S. Geological Survey Identifies Crude-Oil Metabolites in Subsurface Plumes.
11 FracFocus Chemical Disclosure Registry – Hydraulic Fracturing: The Process.
12 U.S. Environmental Protection Agency (2016). Hydraulic Fracturing for Oil and Gas: Impacts from the Hydraulic Fracturing Water Cycle on Drinking Water Resources in the United States (Final Report). EPA/600/R-16/236F.
13 Wyoming Department of Environmental Quality – Pavillion Investigation.
14 “Last two Dimock families settle lawsuit with Cabot over water.” J. Hurdle, NPR StateImpact Pennsylvania, September 26, 2017.
15 Railroad Commission of Texas (2014). Water Well Complaint Investigation Report, Silverado on the Brazos Neighborhood, Parker County, Texas, May 23, 2014.
16 Patterson, L.A. et al. (2017). Unconventional Oil and Gas Spills: Risks, Mitigation Priorities, and State Reporting Requirements. Environ. Sci. Technol., 51(5), 2563-2573.
17 Commonwealth of Pennsylvania – The Pennsylvania Code: § 78.84. Casing standards; and §78.85. Cement standards. In: Chapter 78, Subchapter D: Well Drilling, Operation, and Plugging.
18 Sherwood, O.A. et al. (2016). Groundwater methane in relation to oil and gas development and shallow coal seams in the Denver-Julesburg Basin of Colorado. Proc. Natl. Acad. Sci. U.S.A., 113(30), 8391-8396.
19 Darrah, T.H. et al. (2014). Noble gases identify the mechanisms of fugitive gas contamination in drinking-water wells overlying the Marcellus and Barnett Shales. Proc. Natl. Acad. Sci. U.S.A., 111(39), 14076-14081.
20 Ohio Department of Natural Resources, Division of Mineral Resources Management (2008). Report on the Investigation of the Natural Gas Invasion of Aquifers in Bainbridge Township of Geauga County, Ohio.
21 Boyer, E.W. et al. (2012). The Impact of Marcellus Gas Drilling on Rural Drinking Water Supplies, Final report to the Center for Rural Pennsylvania, March 2012.
22 Baldassare, F. et al. (2014). A geochemical context for stray gas investigations in the northern Appalachian Basin: Implications of analyses of natural gases from Neogene-through Devonian-age strata. AAPG Bull., 98(2), 341-372.
23 McMahon, P.B. et al. (2017). Methane and Benzene in Drinking-Water Wells Overlying the Eagle Ford, Fayetteville, and Haynesville Shale Hydrocarbon Producing Areas. Environ. Sci. Technol., 51(12), 6727-6734.
Part 7: Abandoned Wells
1 U.S. Energy Information Administration – U.S. Oil and Natural Gas Wells by Production Rate.
2 National Petroleum Council (2011). Plugging and Abandonment of Oil and Gas Wells. In: Prudent Development: Realizing the Potential of North America’s Abundant Natural Gas and Oil Resources, Topic Paper #2-25.
3 Orphan Well Association – Frequently Asked Questions.
4 U.S. General Accounting Office (1989). Drinking Water: Safeguards Are Not Preventing Contamination from Injected Oil and Gas Wastes. GAO/RCED-89-97.
5 Image source: https://pixnio.com/miscellaneous/abandoned-gas-well-pump
6 Brandt, A.R. et al. (2014). Methane Leaks from North American Natural Gas Systems. Science, 343, 733-735.
7 Ground Water Protection Council (2011). State Oil and Gas Agency Groundwater Investigations and Their Role in Advancing Regulatory Reforms – A Two-State Review: Ohio and Texas.
8 Townsend-Small, A. et al. (2016). Emissions of coalbed and natural gas methane from abandoned oil and gas wells in the United States. Geophys. Res. Lett., 43, 2283-2290.
9 “Well near Berthoud starts spilling drilling mud 33 years after it was capped.” P. Johnson, Denver Post, October 31, 2017.
10 U.S. Environmental Protection Agency (2016). Hydraulic Fracturing for Oil and Gas: Impacts from the Hydraulic Fracturing Water Cycle on Drinking Water Resources in the United States.
11 Interstate Oil & Gas Compact Commission (2016). State Financial Assurance Requirements.
12 Interstate Oil & Gas Compact Commission – State orphaned and abandoned well programs.
13 Oklahoma Energy Resources Board – Well Site Clean Up.
14 Pennsylvania Department of Environmental Protection (2017). Abandoned and Orphan Oil and Gas Wells and the Well Plugging Program. Fact Sheet 8000-FS-DEP1670.
15 Texas Comptroller – Crude Oil Production Tax.
16 Oklahoma Energy Resources Board – Funding.
17 Interstate Oil & Gas Compact Commission (2009). Orphaned and Abandoned Wells: Innovative Solutions. Groundwork, October 2009.
18 Texas Railroad Commission (2017). Monthly Report of State-funded Well Plugging Activities, August 2017, FY 2017.
19 Texas Railroad Commission (2017). Monthly Report of State-funded Well Plugging Activities, December 2017, FY 2018.
20 Pennsylvania Department of Environmental Protection – 2016 Oil and Gas Annual Report.
21 Oklahoma Energy Resources Board – Restoring Oklahoma’s Land.
22 “Orphan Oil Wells in L.A. Neighborhood to be Permanently Sealed.” California Department of Conservation press release, June 8, 2016.
23 U.S. Government Accountability Office (2011). Oil and Gas Bonds: BLM Needs a Comprehensive Strategy to Better Manage Potential Oil and Gas Well Liability. GAO-11-292.
Part 8: What Determines the Location of a Well?
1 Biewick, L.R.H. (2008). Areas of Historical Oil and Gas Exploration and Production in the United States. U.S. Geological Survey Digital Data Series DDS-69-Q.
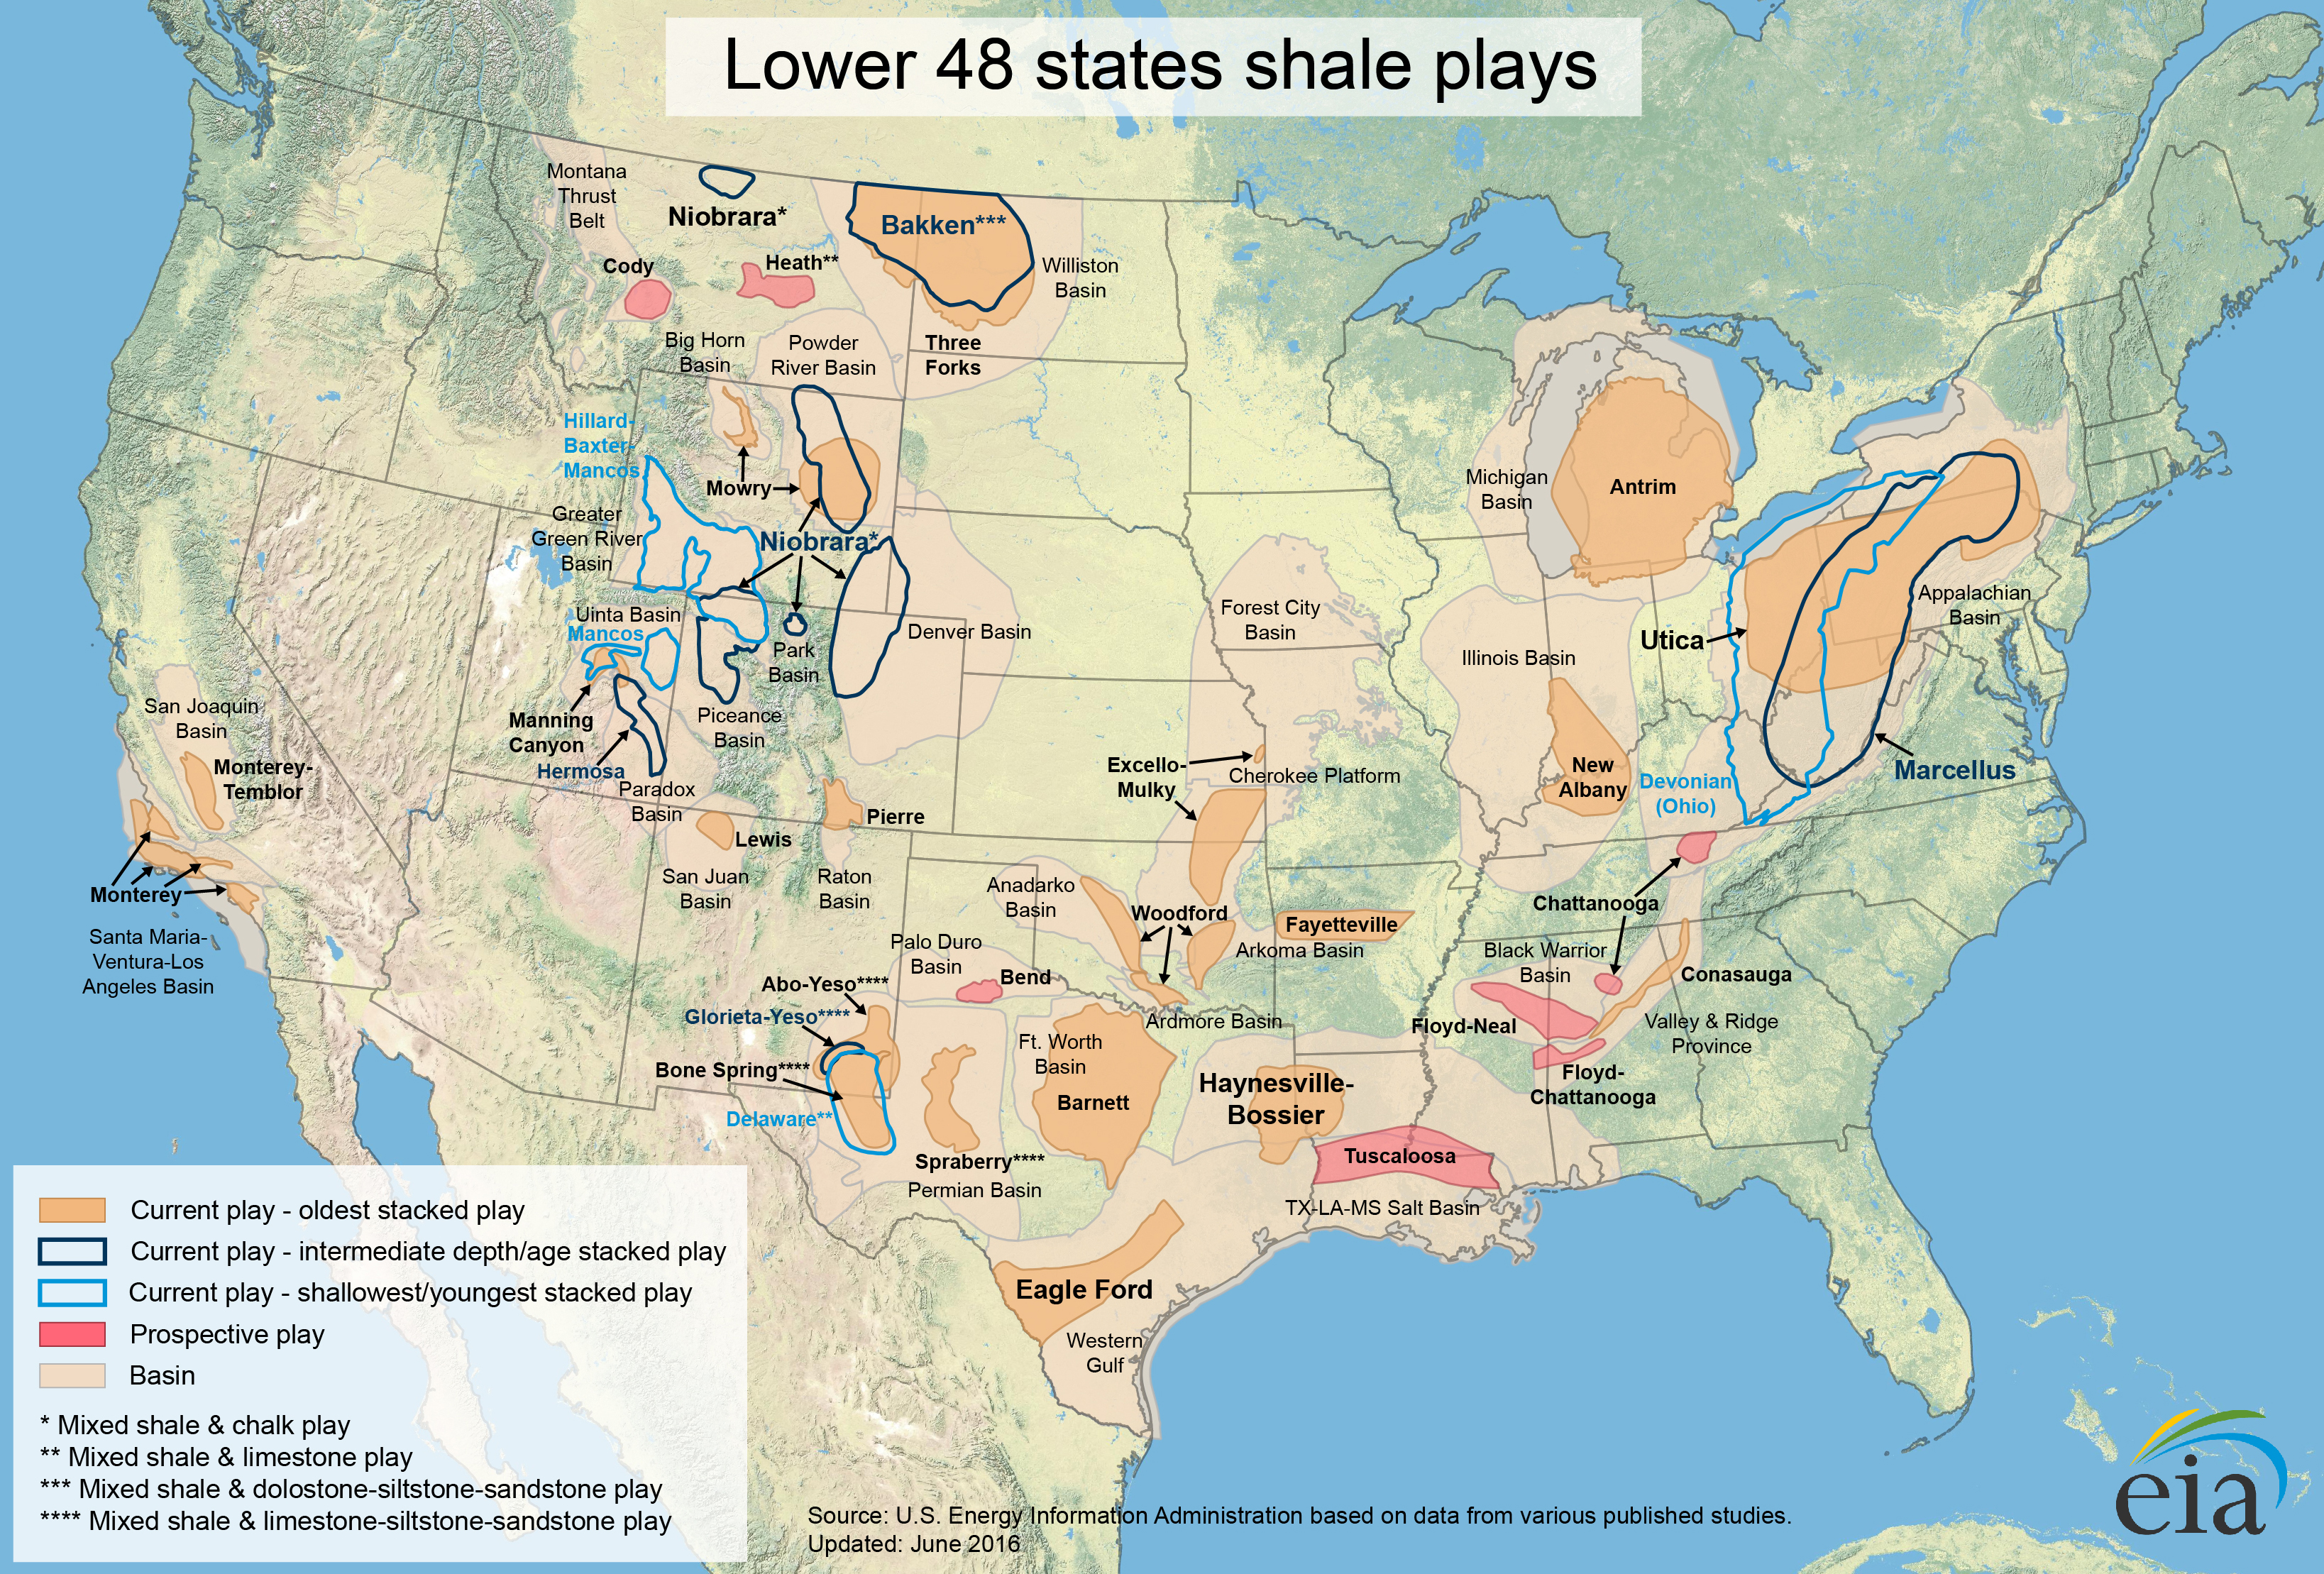
2 U.S. Energy Information Administration – Lower 48 states shale plays, June 2016.
3 U.S. Energy Information Administration (2017). Marcellus Shale Play: Geology Review.
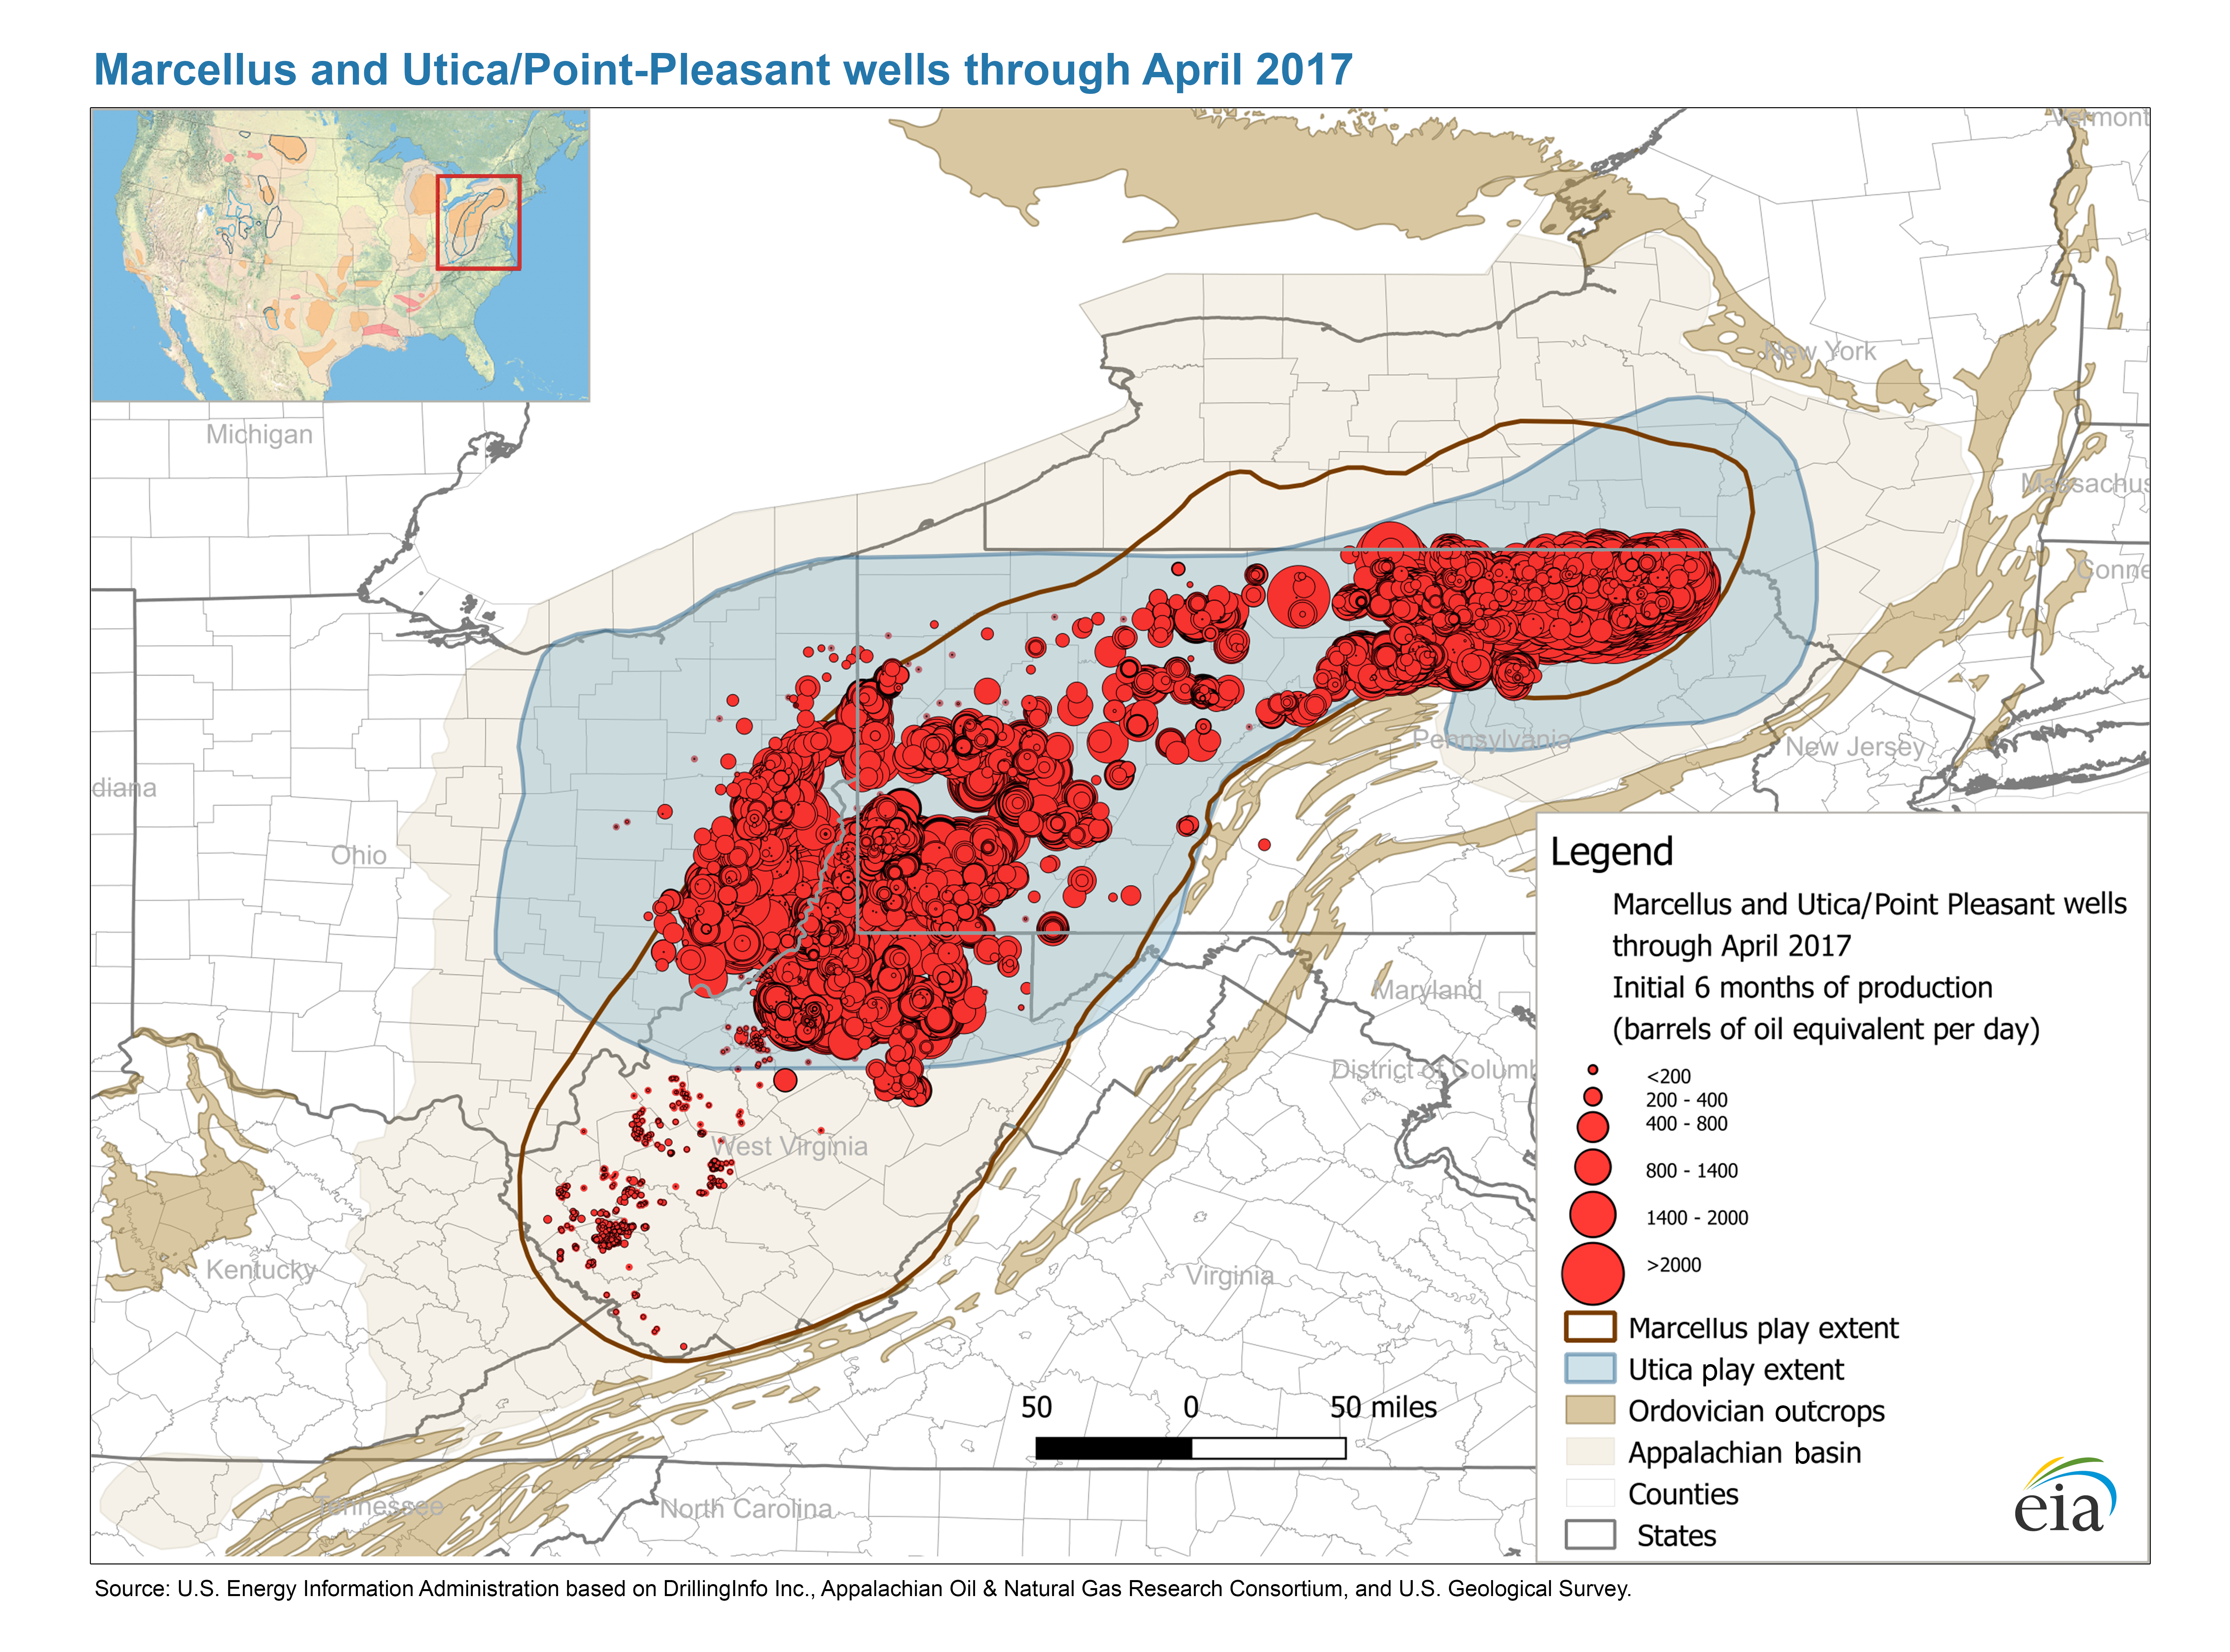
4 U.S. Energy Information Administration – Marcellus and Utica/Point Pleasant wells through April 2017.
5 U.S. Bureau of Land Management – Oil and Gas: Leasing.
6 Pennsylvania Department of Conservation and Natural Resources (2017). Natural Gas Development and State Forests: Shale Gas Leasing Statistical Summary, May 2017.
7 U.S. Bureau of Indian Affairs – Working on Indian Lands.
8 Joy, M.P. and Dimitroff, S.D. (2016). Oil and gas regulation in the United States: overview. Westlaw, June 1, 2016.
9 Bosquez IV, T. et al. (2015). Fracking Debate: The Importance of Pre-Drill Water-Quality Testing. American Bar Association, Section of Litigation: Environmental Litigation.
10 New York Department of Environmental Conservation – High-Volume Hydraulic Fracturing in New York State.
11 General Assembly of Maryland – HB1325 (CH0013): Oil and Natural Gas – Hydraulic Fracturing – Prohibition. Approved by the Governor, April 4, 2017.
12 Vermont Department of Environmental Conservation (2015). A Report on the Regulation and Safety of Hydraulic Fracturing for Oil or Natural Gas Recovery.
13 “BLM Lands Leasing.” Statement of Neil Kornze, Director, Bureau of Land Management, U.S. Department of the Interior, before the House Committee on Oversight and Government Reform, March 23, 2016.
14 U.S. Bureau of Land Management – Oil and Gas Statistics: Table 8 – Wells Spud.
15 U.S. Army Corps of Engineers (2017). U.S. Army Corps of Engineers Regulatory Role in Activities Associated with Oil and Natural Gas Production and Distribution, June 2017.
16 U.S. Environmental Protection Agency – What is the National Environmental Policy Act?
17 U.S. Bureau of Land Management – How We Manage.
18 The Nature Conservancy – LEEP: The Nature Conservancy’s Appalachian Shale Siting Tool.
19 The Nature Conservancy and Carnegie Mellon University (2016). Advancing the Next Generation of Environmental Practices for Shale Development: Workshop Deliberations and Recommendations. May 27-29, 2015. Pittsburgh, PA.
20 “Halliburton, Eclipse Resources complete longest lateral well in U.S.” World Oil Magazine, May 31, 2016.
21 U.S. Energy Information Administration – Crude Oil and Natural Gas Drilling Activity.
22 U.S. Department of Energy – Enhanced Oil Recovery.
23 “What is “Forced” Pooling and Why is it Important?” J. Luellen, Husch Blackwell Emerging Energy Insights, April 25, 2017.
24 U.S. Energy Information Administration (2016). EIA report shows decline in cost of U.S. oil and gas wells since 2012. Today in Energy, March 30, 2016.
25 Railroad Commission of Texas (2017). Summary of Drilling, Completion and Plugging Reports Processed for 2016.
Part 9: Land Use in the Oil and Gas Industry
1 State of California – § 1776. Well Site and Lease Restoration, California Statutes and Regulations for the Division of Oil, Gas, & Geothermal Resources, January 2018.
2 Kansas Office of Revisor of Statutes – Kansas Statutes Chapter 55: Oil and Gas, Article 1: Oil and Gas Wells; Regulatory Provisions, 55-177: Removal of structures and abutments from lands after abandoning wells; exception.
3 Commonwealth of Pennsylvania – The Pennsylvania Code: § 78.a.65. Site restoration.
4 Bureau of Land Management (2007). Chapter 6 – Reclamation and Abandonment. In: Surface Operating Standards and Guidelines for Oil and Gas, Fourth Edition – Revised 2007.
5 Penn State Public Broadcasting – Explore Shale: How much land in Pennsylvania has been affected by Marcellus Shale drilling? Based on data from FracTracker Alliance and the Pennsylvania Department of Environmental Protection.
6 U.S. Government Accountability Office (2014). Updated Guidance, Increased Coordination, and Comprehensive Data Could Improve BLM’s Management and Oversight.
7 “Halliburton, Eclipse Resources complete longest lateral well in U.S.” World Oil Magazine, May 31, 2016.
8 Cochener, J. (2010). Quantifying Drilling Efficiency. Working Paper, U.S. Energy Information Administration.
9 Railroad Commission of Texas – Oil and Gas Well Records.
10 U.S. Energy Information Administration – Natural Gas Annual Respondent Query System (EIA-757 Data through 2014): 757 Processing Capacity.
11 U.S. Energy Information Administration – Number and Capacity of Petroleum Refineries.
12 McDonald, R.I. et al. (2009). Energy Sprawl or Energy Efficiency: Climate Policy Impacts on Natural Habitat for the United States of America. PLoS ONE 4(8): e6802.
Part 10: The Pinedale Gas Field, Wyoming
1 Wyoming State Geological Survey – Cultural Geology Guide: Pinedale Anticline.
2 U.S. Bureau of Land Management (2008). Record of Decision for the Supplemental Environmental Impact Statement for the Pinedale Anticline Oil and Gas Exploration and Development Project, Sublette County, Wyoming.
3 “Wyoming natural gas production falls for sixth consecutive year; U.S. production rises.” B. Storrow, Casper Star Tribune, January 5, 2016.
4 U.S. Energy Information Administration (2017). Marcellus Region: Drilling Productivity Report, July 2017.
5 AAPG Wiki – Pinedale field.
6 U.S. Fish and Wildlife Service – Greater Sage-Grouse.
7 Hayden-Wing Associates, LLC (2016). Pygmy Rabbit Monitoring in the Pinedale Anticline Project Area, Sublette County, Wyoming, 2016. Report prepared for Wyoming Game and Fish Department, Pinedale Anticline Project Office, and Bureau of Land Management, Pinedale, Wyoming.
8 Sawyer, H. et al. (2017). Mule deer and energy development – Long-term trends of habituation and abundance. Glob. Chang. Biol., 23, 4521-4529.
9 U.S. Bureau of Land Management (1987). Pinedale Resource Area: proposed resource management plan / environmental impact statement: final.
10 U.S. Bureau of Land Management (1989). Record of decision and resource management plan for the Pinedale Resource Area.
11 U.S. Bureau of Land Management (2008). Pinedale Resource Management Plan.
12 Except where otherwise referenced, information in this section comes from communications with BLM Pinedale Anticline Project Office staff, June 30, 2017.
13 Boschee, P. (2012). Handling Produced Water from Hydraulic Fracturing. Oil and Gas Facilities Magazine, 1 (1).
14 Shafer, L. (2011). Water Recycling and Purification in the Pinedale Anticline Field: Results from the Anticline Disposal Project. SPE Americas E&P Health, Safety, Security, and Environmental Conference, 21-13 March, Houston, Texas, USA.
15 Wyoming Department of Environmental Quality (2015). Proposed Revisions to the Chapter 6, Section 2 Oil and Gas Production Facilities Permitting Guidance. Technical Support Document.
16 U.S. Environmental Protection Agency (2016). Determinations of Attainment by the Attainment Date, Extensions of the Attainment Date, and Reclassification of Several Areas for the 2008 Ozone National Ambient Air Quality Standards. Federal Register, 81 (86), p. 26697-26722, May 4, 2016.
Part 11: Heavy Oil
1 U.S. Geological Survey (2003). Heavy Oil and Natural Bitumen: Strategic Petroleum Resources.
2 Natural Resources Canada – Environmental Challenges.
3File:Aurora – tar sands.png. Wikimedia Commons user Int23.. Reproduced according to a CC BY-SA 4.0 license.
4 Natural Resources Canada – Oil Sands Extraction and Processing.
5 American Association of Petroleum Geologists, Energy Minerals Division (2015). Unconventional Energy Resources: 2015 Review. Natural Resources Research, 24, 443-508.
6 Koottungal, L. (2014). 2014 worldwide EOR survey. Oil & Gas Journal, 112(4), 78-91.
7 Society of Petroleum Engineers PetroWiki – Cold heavy oil production with sand.
8 Carnegie Endowment for International Peace – Oil-Climate Index: Profiling Emissions in the Supply Chain.
9 Gosselin, P. et al. (2010). Environmental and Health Impacts of Canada’s Oil Sands Industry. The Royal Society of Canada Expert Health Panel, December 2010.
10 Frank, R.A. et al. (2014). Profiling Oil Sands Mixtures from Industrial Developments and Natural Groundwaters for Source Identification. Env. Sci. Technol., 48(%), 2660-2670.
11 Roy, J.W. et al. (2016). Assessing Risks of Shallow Riparian Groundwater Quality Near an Oil Sands Tailings Pond. Groundwater, 54(4), 545-558.
12 Government of Canada – Monitoring air quality in Alberta oil sands.
13 Government of Canada (2015). Oil Sands: Land Use and Reclamation. Factsheet, May 2015.
14Tar Sands, Alberta. Howl Arts Collective, Flickr. Reproduced according to a CC BY 2.0 license.
15 Canada National Energy Board – Commodity Statistics, Summary Crude Oil Export by Type.
16 U.S. Energy Information Administration – Petroleum & Other Liquids: U.S. Imports by Country of Origin.
Part 12: Oil and Gas in the U.S. Arctic
1 U.S. Geological Survey (2008). Circum-Arctic Resource Appraisal: Estimated of Undiscovered Oil and Gas North of the Arctic Circle. Fact Sheet 2008-3049.
2 Alaska Department of Transportation & Public Facilities – Arctic Port Study.
3 Comay, L.B. et al. (2018). Arctic National Wildlife Refuge (ANWR): An Overview. Congressional Research Service, 7-5700, January 9, 2018.
4 U.S. Bureau of Land Management – National Petroleum Reserve in Alaska.
5 Attanasi, E.D. (2003). Economics of Undiscovered Oil in the Federal Lands of the National Petroleum Reserve, Alaska. U.S. Geological Survey Open-File Report 03-044.
6 U.S. Geological Survey (2017). Assessment of Undiscovered Oil and Gas Resources in the Cretaceous Nanushuk and Torok Formations, Alaska North Slope, and Summary of Resource Potential of the National Petroleum Reserve in Alaska, 2017. Fact Sheet 2017-3088.
7 U.S. Fish and Wildlife Service – Arctic: National Wildlife Refuge-Alaska.
8 U.S. Geological Survey – Arctic National Wildlife Refuge, 1002 Area, Petroleum Assessment, 1998 (revised), Including Economic Analysis. Fact Sheet 0028-01: Online Report.
9H.R. 1 – An Act to provide for reconciliation pursuant to titles II and V of the concurrent resolution on the budget for fiscal year 2018. 115th Congress (2017-2018).
10 U.S. Bureau of Ocean Energy Management – Outer Continental Shelf.
11 Alaska Oil and Gas Conservation Commission – Northstar Oil Pool Statistics.
12 Bureau of Ocean Energy Management – 2019-2024 National Outer Continental Shelf Oil and Gas Leasing Program.
13Alaska Oil and Gas Conservation Commission.
14 U.S. Bureau of Safety and Environmental Enforcement – Fact Sheet: Arctic Drilling Rule.
15 The Pew Charitable Trusts (2013). Arctic Standards: Recommendations on Oil Spill Prevention, Response, and Safety in the U.S. Arctic Ocean.
16 “The Only Safe Arctic Drilling is No Arctic Drilling.” Natural Resources Defense Council Press Release, July 7, 2016.
17 National Research Council (2003). Cumulative Environmental Effects of Oil and Gas Activities on Alaska’s North Slope. Washington, DC: The National Academies Press.
18 Alaska Oil and Gas Conservation Commission – Colville River Unit, Alpine Oil Pool.
19 Alaska Oil and Gas Conservation Commission – Production.
20 U.S. Bureau of Land Management (2015). Supplemental Environmental Impact Statement for the Alpine Satellite Development Plan for the Proposed Greater Mooses Tooth One Development Project: Record of Decision, February 2015.
21 Alyeska Pipeline Service Company – Safety & Environment: Permafrost.
22 Alyeska Pipeline Service Company – Trans Alaska Pipeline System Facts.
23 Alyeska Pipeline Service Company – Earthquake Protection.
24 U.S. Geological Survey – Denali Fault: Alaska Pipeline.
25 Nuka Research and Planning Group (2013). Oil Spill Occurrence Rates for Alaska North Slope Crude & Refined Oil Spills. Report to the Bureau of Ocean Energy Management, October 2013. OCS Study BOEM 2013-205.
26 Alaska Department of Environmental Conservation – PRP Spills Database Search.
27 “BP Exploration Alaska to Pay $25 Million Penalty for Alaskan North Slope Oil Spill.” U.S. Department of Justice, May 3, 2011.
28 Alaska Department of Environmental Conservation – GC-2 Transit Line Spill: Tundra Treatment Plan Rev.1, March 18, 2006.
29 U.S. Bureau of Safety and Environmental Enforcement – Arctic Oil Spill Response Research.
30 Alaska Department of Environmental Conservation – 30 Years after the Exxon Valdez.
31 U.S. National Oceanic and Atmospheric Administration – 25 Years Later: Timeline of Recovery from Exxon Valdez Oil Spill.
32 U.S. Bureau of Safety and Environmental Enforcement – International Forums: The Arctic Offshore Regulators Forum (AORF).
33 U.S. Energy Information Administration – Alaska North Slope Crude Oil Production.
Part 13: Offshore Oil and Gas
1 U.S. Energy Information Administration (2016). Trends in U.S. Oil and Natural Gas Upstream Costs, March 2016.
2 U.S. Energy Information Administration – Crude Oil Production.
3 U.S. Energy Information Administration – Natural Gas Gross Withdrawals and Production.
4 U.S. Department of the Interior – Natural Resources Revenue Data.
5 U.S. Energy Information Administration (2016). Offshore production nearly 30% of global crude oil output in 2015. Today in Energy, October 25, 2016.
6 U.S. Energy Information Administration (2016). Offshore oil production in deepwater and ultra-deepwater is increasing. Today in Energy, October 28, 2016.
7 Woods Hole Oceanographic Institution – Oil in the Ocean: FAQs.
8 U.S. Bureau of Ocean Energy Management (formerly Minerals Management Service) (2000). Deepwater Development: A Reference Document for the Deepwater Environmental Assessment, Gulf of Mexico OCS (1998 through 2007). MMS 2000-015.
9 U.S. Energy Information Administration (2016). Crude oil prices started 2015 relatively low, ended the year lower. Today in Energy, January 6, 2016.
10 U.S. Energy Information Administration – Monthly Crude Oil and Natural Gas Production, Crude Oil, Federal Offshore Gulf of Mexico.
11 “Department of Energy to Invest $30 Million to Boost Unconventional Oil and Natural Gas Recovery.” U.S. Department of Energy, January 3, 2018.
12 DeepStar Program – About Us.
13 American Geosciences Institute (2016). Offshore Energy.
14 “Seismic, Supercomputing Power Leads BP to More GoM Resources.” V. Addison, Exploration and Production Magazine, April 28, 2017.
15 Dusseault, M.B. et al. (2004). Drilling Through Salt: Constitutive Behavior and Drilling Strategies. 6th North American Rock Mechanics Symposium, 5-9 June, Houston, Texas.
16 Shadravan, A. and Amani, M. (2012). HPHT 101: What Every Engineer or Geoscientist Should Know about High Pressure High Temperature Wells. SPE Kuwait International Petroelum Conference and Exhibition, 10-12 December, Kuwait City, Kuwait.
17 “Drilling advances: Between a rock and a hot place.” J. Redden, World Oil, vol. 237, no. 11, November 2016.
18 Pai, S. (2016). Managing Risks around Rigs Using Autonomous Marine Vehicles. SPE/IADC Middle East Drilling Technology Conference and Exhibition, 26-28 January, Abu Dhabi, UAE.
19 U.S. Global Change Research Program – 2014 National Climate Assessment: Changes in Hurricanes.
20Transocean’s Development Driller II. U.S. Coast Guard photo by Petty Officer 3rd Classy Barry Bena. Accessed via Wikimedia Commons.
21 Clarke, K.C. and Hemphill, J.J. (2002). The Santa Barbara Oil Spill: A Retrospective. Yearbook of the Association of Pacific Coast Geographers, 64, 157-162.
22 U.S. National Oceanic and Atmospheric Administration, Office of Response and Restoration – It Took More Than the Exxon Valdez Oil Spill to Pass the Historic Oil Pollution Act of 1990.
23 National Academy of Engineering and National Research Council (2012). Macondo Well Deepwater Horizon Blowout: Lessons for Improving Offshore Drilling Safety. Washington, DC: The National Academies Press.
24 U.S. Department of the Interior – Responsibilities Guide (BOEM & BSEE).
25 “U.S. and Five Gulf States Reach Historic Settlement with BP to Resolve Civil Lawsuit Over Deepwater Horizon Spill.” U.S. Department of Justice, October 5, 2015.
26 U.S. Bureau of Ocean Energy Management – BOEM Gulf of Mexico OCS Region Blocks and Active Leases by Planning Area, February 1, 2018.
27 U.S. National Oceanic and Atmospheric Administration – Deepwater Horizon oil spill settlements: Where the money went.
28 Gulf of Mexico Research Institute: Investigating the effect of oil spills on the environment and public health.
29 “BSEE Responds to Oil Release in the Gulf of Mexico.” U.S. Bureau of Safety and Environmental Enforcement, October 13, 2017.
30 “UPDATE 2: Coast Guard, federal agencies responding to offshore oil spill.” U.S. Coast Guard, October 19, 2017.
31 U.S. Coast Guard (2015). Taylor Energy Oil Discharge at MC-20A Well Site and Ongoing Response Efforts. Incident Archive – Taylor Energy (Mississippi Canyon) Oil Spill – U.S. Coast Guard Fact Sheet, May 13, 2015.
32 U.S. Bureau of Safety and Environmental Enforcement (2016). Oil and Gas and Sulfur Operations in the Outer Continental Shelf-Blowout Preventer Systems and Well Control. Federal Register, 81, p. 25887-26038, April 4, 2016.
33 U.S. Bureau of Ocean Energy Management – Development of a New National OCS Program (2019-2024).
Part 14: Spills in Oil and Natural Gas Fields
1 U.S. Pipeline and Hazardous Materials Safety Administration – Incident Statistics.
2 Patterson, L.A. et al. (2017). Unconventional Oil and Gas Spills: Risks, Mitigation Priorities, and State Reporting Requirements. Environ. Sci. Technol., 51(5), 2563-2573.
3 U.S. Federal Highway Administration – Freight Facts and Figures 2013: Table 5-18. Number and Volume of Oil Spills In and Around U.S. Waterways: 1990, 2000, and 2009-2011.
4 U.S. Bureau of Ocean Energy Management (2013). Oil Spill Occurrence Rates for Alaska North Slope Crude & Refined Oil Spills. Nuka Research & Planning Group, LLC, for BOEM, October 2013. OCS Study BOEM 2013-205.
5 National Oceanic and Atmospheric Administration – How Do Oil Spills out at Sea Typically Get Cleaned Up?
6 Image from U.S. Bureau of Land Management. Accessed at: “Company faces $10K for spill near Green River.” B. Maffly, The Salt Lake Tribune, September 4, 2015.
7 U.S. Environmental Protection Agency (2015). Review of State and Industry Spill Data: Characterization of Hydraulic Fracturing-Related Spills.
8 Maloney, K.O. et al. (2016). Unconventional oil and gas spills: Materials, volumes and risks to surface waters in four states of the U.S.. Sci. Total Environ., 581-582, 369-377.
9 FracFocus Chemical Disclosure Registry.
10 API Energy – Oil Spill Prevention and Response: Land.
11 U.S. Fish & Wildlife Service (2010). Effects of Oil on Wildlife and Habitat. Fact Sheet, June 2010.
12 U.S. Geological Survey – Marcellus Shale Storage Tanks.
13 U.S. Environmental Protection Agency – Oil Spills Prevention and Preparedness Regulations.
14 U.S. Environmental Protection Agency (2015). Review of State and Industry Spill Data: Characterization of Hydraulic Fracturing-Related Spills.
15 U.S. Federal Emergency Management Agency – Oil spill clean up in Kansas.
16 API Energy – Oil Spill Prevention and Response: Land.
17 API Energy – Oil Spill Prevention and Response: Wildlife Cleanup.
18 Minnesota Pollution Control Agency – National Crude Oil Spill Research Site in Bemidji, Minnesota.
19 API Energy – Oil Spill Prevention and Response: Toolkit.
20 U.S. Geological Survey – Produced Waters Database.
21 U.S. Geological Survey (2003). Environmental Impacts of Petroleum Production: Initial Results from the Osage-Skiatook Petroleum Environmental Research Sites, Osage County, Oklahoma. Water-Resources Investigation Report 03-4260.
22 Cozzarelli, I.M. et al. (2017). Environmental signatures and effects of an oil and gas wastewater spill in the Williston Basin, North Dakota. Sci. Total Environ., 579, 1781-1793.
23 U.S. Environmental Protection Agency – Blacktail Creek Spill, Marmon, ND, Region VIII.
24 U.S. Environmental Protection Agency – Blacktail Creek Spill.
Part 15: Transportation of Oil, Gas, and Refined Products
1 U.S. Pipeline and Hazardous Materials Safety Administration – National Pipeline Mapping System.
2 U.S. Pipeline and Hazardous Materials Administration – Annual Report Mileage Summary Statistics.
3 American Petroleum Institute and Association of Oil Pipe Lines (2016). Pipeline Performance Report & Strategic Plan.
4 U.S. Energy Information Administration – Petroleum and Other Liquids: Product Supplied.
5 U.S. Energy Information Administration – Movements of Crude Oil and Selected Products by Rail.
6 U.S. Energy Information Administration – Crude-by-rail volumes to the East Coast are declining. Today in Energy, August 3, 2016.
7 Canada National Energy Board – Canadian Crude Oil Exports by Rail – Monthly Data.
8 National Tank Truck Carriers (2015). Tank Truck Industry Market Analysis.
9 The Brattle Group (2014). Understanding Crude Oil and Product Markets. Prepared for the American Petroleum Institute.
10 Texas A&M Transportation Institute, Center for Ports and Waterways (2017). A Modal Comparison of Domestic Freight Transportation Effects on the General Public, 2001 – 2014. Prepared for the National Waterways Foundation.
11 File:Oil Barge at the Cape Cod Canal.jpg. Wikimedia Commons user Pvalerio. Reproduced according to a CC BY 3.0 license.
12 U.S. Energy Information Administration – U.S. Domestic Crude Oil Refinery Receipts by Barge.
13 U.S. Energy Information Administration – Monthly Energy Review: Petroleum, March 2018.
14 U.S. Energy Information Administration – Exports by Destination: Total Crude Oil and Products.
15 Natural Resources Canada – Frequently Asked Questions (FAQs) Concerning Federally-Regulated Petroleum Pipelines in Canada.
16 Canada National Energy Board – 2016 Oil Exports Statistics Summary.
17 U.S. Energy Information Administration (2018). 2018 Annual Energy Outlook: Natural Gas Imports and Exports.
18 U.S. Energy Information Administration – Petroleum and Other Liquids: U.S. Imports by Country of Origin.
19 U.S. Energy Information Administration – Petroleum and Other Liquids: Exports by Destination.
20 United Nations Conference on Trade and Development (2017). Review of Maritime Transport 2017.
21 U.S. Energy Information Administration (2018). Natural gas prices, production, and exports increased from 2016-2017. Today in Energy, January 16, 2018.
22 U.S. Federal Energy Regulatory Commission – North American LNG Import/Export Terminals Approved (As of January 24, 2018).
23 U.S. Department of Energy (2018). LNG Monthly, January 2018.
24 U.S. Energy Information Administration – U.S. Natural Gas Exports and Re-Exports by Point of Exit.
25 U.S. Energy Information Administration – The Basics of Underground Natural Gas Storage.
26 U.S. Department of Energy – Strategic Petroleum Reserve.
27 U.S. Department of Energy – Northeast Home Heating Oil Reserve.
28 U.S. Department of Energy – Northeast Gasoline Supply Reserve.
29 U.S. Energy Information Administration – Energy Explained: Use of Heating Oil.
30 U.S. Pipeline and Hazardous Materials Safety Administration – Office of Hazardous Materials Safety: Incident Reports Database Search.
31 U.S. Pipeline and Hazardous Materials Safety Administration – Pipeline Incident 20 Year Trends: All Reported Incident 20 Year Trend.
32 U.S. Environmental Protection Agency – Extracting the Damaged Pipeline. Accessed on Flickr.
33 Carter, J.M. et al. (2016). Estimating National Water Use Associated with Unconventional Oil and Gas Development. U.S. Geological Survey, Fact Sheet 2016-3032, May 2016.
34 Maupin, M.A. et al. (2014). Estimated Water Use in the United States in 2010. U.S. Geological Survey, Circular 1405.
35 U.S. Environmental Protection Agency – Water & Energy Efficiency by Sectors: Oil Refineries.
36 Veil, J. (2015). U.S. Produced Water Volumes and Management Practices in 2012.
37 "Management of Oil Field Wastes." P. Wright, Oil & Gas Law Report, March 29, 2013.
38 U.S. Pipeline and Hazardous Materials Safety Administration (2012). Leak Detection Study, DTPH56-11-D-000001.
39 U.S. Pipeline and Hazardous Materials Safety Administration – PHMSA Pipeline Technical Resources.
40 Federal Energy Regulatory Commission – What FERC Does.
Part 16: Oil Refining and Gas Processing
1 File:Crude Oil Distillation-en. Wikimedia Commons users Psarianos & Theresa Knott. Reproduced according to a CC BY-SA 3.0 license.
2 Centre for Industry Education Collaboration, University of York (2014). Cracking and related refinery processes. The Essential Chemical Industry – online.
3 Kokayeff, P. et al. (2014). Hydrotreating in Petroleum Processing. In: Treese, S., Jones, D., Pujado, P. (eds). Handbook of Petroleum Processing. Springer, Cham.
4 U.S. Energy Information Administration (2013). Alkylation is an important source for octane in gasoline. Today in Energy, February 13, 2013.
5 U.S. Environmental Protection Agency – Gasoline Standards: Gasoline Reid Vapor Pressure.
6 U.S. Energy Information Administration – Biofuels: Ethanol and Biodiesel Explained – Use of Ethanol.
7 U.S. Energy Information Administration – Oil: Crude and Petroleum Products Explained – Refining Crude Oil.
8 U.S. Energy Information Administration – Petroleum & Other Liquids: U.S. Product Supplied, Total Crude Oil and Petroleum Products.
9 U.S. Energy Information Administration – U.S. Natural Gas Gross Withdrawals.
10 U.S. Energy Information Administration – Natural Gas Annual Respondent Query System, EIA-757: Natural Gas Processing Capacity by Plant, Data through 2014.
11 U.S. Energy Information Administration – U.S. Dry Natural Gas Production.
12 North American Energy Standards Board.
13 Penn State College of Earth and Mineral Sciences, e-Education Institute – Petroleum Processing: Natural Gas Composition and Specifications.
14 Rufford, T.E. et al. (2012). The removal of CO2 and N2 from natural gas: A review of conventional and emerging process technologies. J. Pet. Sci. Eng., 94-95, 123-154.
15 Sep-Pro Systems – Nitrogen Rejection Units.
16 U.S. Energy Information Administration (2006). Natural Gas Processing: The Crucial Link between Natural Gas Production and Its Transportation to Market.
17 U.S. Energy Information Administration – U.S. Energy Mapping System.
18 U.S. Department of Energy (2017). Natural Gas Liquids Primer, with a Focus on the Appalachian Region.
19 U.S. Environmental Protection Agency (2017). Inventory of U.S. Greenhouse Gas Emissions and Sinks: 1990-2015.
20 Global CCS Institute – Projects Database: Large-scale CCS facilities.
Part 17: Non-Fuel Products of Oil and Gas
1 U.S. Energy Information Administration – How much oil is used to make plastic?
2 U.S. Energy Information Administration (2015). Growing U.S. HGL production spurs petrochemical industry investment. Today in Energy, January 29, 2015.
3 U.S. Energy Information Administration – U.S. Refinery Net Production of Naphtha for Petrochemical Feedstock Use.
4 Plotkin, J.S. (2016). Beyond the Ethylene Steam Cracker. American Chemical Society.
5 Mitsubishi Chemical Techno-Research, LPG Conference, March 7, 2017.
6 Plotkin, J.S. (2015). The Propylene Gap: How Can It Be Filled? American Chemical Society.
7 U.S. Geological Survey (2018). Nitrogen (Fixed) – Ammonia. Mineral Commodity Summaries, 2018.
8 Hess, J. et al. (2011). Petroleum and Health Care: Evaluating and Managing Health Care’s Vulnerability to Petroleum Supply Shifts. Am. J. Pub. Health, 101(9), 1568-1579.
9 American Cleaning Institute – Soaps & Detergents: Chemistry (Surfactants).
10 U.S. Department of Agriculture, Economic Research Service – Fertilizer Use and Price, 2018.
11 U.S. Energy Information Administration (2017). First world-scale, greenfield nitrogenous fertilizer plant opened in over 25 years. Natural Gas Weekly Update, May 4, 2017.
12 Penn State Extension – Gas, Cracker, Polymer, Pellets – Ethane’s Journey to Plastics. Shale Gas Webinar, September 21, 2017.
13 U.S Energy Information Administration – Natural Gas Gross Withdrawals and Production.
14 U.S. Energy Information Administration (2017). Appalachian natural gas processing capacity key to increasing natural gas, NGPL production. Today in Energy, August 29, 2017.
15 U.S. Energy Information Administration (2016). Short-term Outlook for Hydrocarbon Gas Liquids.
16 Shell – Pennsylvania Chemicals Project: Frequently Asked Questions.
17 File:Top dressing winter wheat – geograph.org.uk – 1740985. Wikimedia Commons, Author: Michael Trolove. Reproduced according to a CC BY-SA 2.0 license.
18 Photo by Airman Valerie Monroy, U.S. Air Force.
19 Vaseline – What is Petroleum Jelly, and What is it Used For?
20 Connelly, D. (2014). A history of aspirin. Clinical Pharmacist, September 2014, 6(7), online.
21 U.S. Geological Survey (2018). Sulfur. Mineral Commodity Summaries, 2018.
22 Apodaca, L.E. (2017). Sulfur. 2015 Minerals Yearbook, U.S. Geological Survey.
23 U.S. Geological Survey (2018). Helium. Mineral Commodity Summaries, 2018.
24 File:MRI-Philips.JPG. Wikimedia Commons user Jan Ainali. Reproduced according to a CC BY 3.0 license.
25 Barnes, D.K.A. et al. (2009). Accumulation and fragmentation of plastic debris in global environments. Phil. Trans. R. Soc. B, 364,1985-1998.
26 Ryan, P.G. (1990). The effects of ingested plastic and other marine debris on seabirds. NOAA Technical Memo NOAA-TM-NMFS-SWFSC-154.
27 U.S. Environmental Protection Agency – Nutrient Pollution: The Sources and Solutions: Agriculture.
28 U.S. Environmental Protection Agency – Emergency Response: Sorbents. EPA Archive, January 19, 2017.
29 U.S. Environmental Protection Agency – National Pollutant Discharge Elimination System.
30 File:Silt fence EPA. Obtained from Wikimedia Commons. Public Domain.
31 Rochelle, G.T. (2009). Amine Scrubbing for CO2 capture. Science, 325, 1652-1654.
32 “Petra Nova, World’s Largest Post-Combustion Carbon Capture Project, Begins Commerical Operation.” U.S. Department of Energy, Office of Fossil Energy, January 11, 2017.
33 Container Recycling Institute – Plastic Facts and Statistics.
34 Plastic Film Recycling – Learn What’s Recyclable.
35 American Chemistry Council – What Plastics Can Become.
36 U.S. Environmental Protection Agency (2016). Advancing Sustainable Materials Management: 2014 Fact Sheet.
Part 18: Air Quality Impacts of Oil and Gas
1 World Health Organization – Ambient (outdoor) air quality and health.
2 U.S. National Park Service – Where Does Air Pollution Come From?
3 Bernice 1 and 2 wells with moisture flare – Evanson Place – Arnegard North Dakota – 2013-07-04. Flickr user Tim Evanson. Reproduced according to a CC BY-SA 2.0 license.
4 U.S. Environmental Protection Agency – Air Emissions Sources.
5 U.S. Environmental Protection Agency – What are Hazardous Air Pollutants?
6 U.S. Environmental Protection Agency – Overview of the Clean Air Act and Air Pollution.
7 U.S. Environmental Protection Agency – The Clean Air Act in a Nutshell: How it Works, March 2013.
8 U.S. Environmental Protection Agency – New Source Performance Standards.
9 U.S. Environmental Protection Agency – Air Emissions Inventories: National Summary of VOC Emissions.
10 Schade, G.W. and Roest, G. (2016). Analysis of non-methane hydrocarbon data from a monitoring station affected by oil and gas development in the Eagle Ford shale, Texas. Elem. Sci. Anth., 4, 96.
11 Texas Commission on Environmental Quality – Air Quality: Eagle Ford Shale Geological Area.
12 U.S. Environmental Protection Agency – Enforcement: Civil Cases and Settlements.
13 U.S. Environmental Protection Agency – Enforcement: Petroleum Refinery National Case Results.
14 U.S. Environmental Protection Agency – Clear Air Act Standards and Guidelines for Petroleum Refineries and Distribution Industry.
15 U.S. Environmental Protection Agency (2011). Toxic Release Inventory (TRI) Program: Lifting of Administrative Stay for Hydrogen Sulfide.
16 U.S. Environmental Protection Agency – AP 42: Compilation of Air Emission Factors, Fifth Edition, Volume 1, Chapter 5: Petroleum Industry.
17 U.S. Environmental Protection Agency – Reducing Emissions of Hazardous Air Pollutants.
18 “Oil Refiners to Reduce Air Pollution at Six Refineries Under Settlement with EPA and Department of Justice.” U.S. Department of Justice Press Release, July 18, 2016.
19 U.S. Environmental Protection Agency (2010). Available and emerging technologies for reducing greenhouse gas emissions from the petroleum refining industry.
20 Bay Area Air Quality Management District (2015). Petroleum Refinery Emissions Reduction Strategy: Workshop Report, September 2015.
21 Sage Environmental Consulting for the American Fuel and Petrochemical Manufacturers (2015). Historical Air Emissions from United States Petroleum Refineries.
22 Texas Commission on Environmental Quality (2016). APWL [Air Pollution Watch List] Proposed Change Document: Delisting – Benzene, Galena Park, TX.
23 File:Houston Ship Channel Galena. U.S. Army Corps of Engineers. Accessed via Wikimedia Commons. Public Domain.
24 U.S. Environmental Protection Agency – Air Quality – National Summary.
25 U.S. Environmental Protection Agency (2017). AirTrends Annual Report: Unhealthy Air Quality Days Trending Down.
26 “EPA Takes Final Step in Phaseout of Leaded Gasoline.” U.S. Environmental Protection Agency Press Release, January 29, 1996.
27 U.S. Federal Aviation Administration – About Aviation Gasoline.
28 U.S. Environmental Protection Agency – Lead Trends.
29 U.S. Environmental Protection Agency – Table of Historical Sulfur Dioxide National Ambient Air Quality Standards (NAAQS).
30 U.S. Environmental Protection Agency – Acid Rain Program: Overview.
31 U.S. Environmental Protection Agency (2017). AirTrends Annual Report: Air Quality Improves as America Grows.
32 U.S. Environmental Protection Agency – Table of Historical Particulate Matter (PM) National Ambient Air Quality Standards.
33 U.S. Environmental Protection Agency – Table of Historical Ozone National Ambient Air Quality Standards.
34 U.S. Environmental Protection Agency – Air Pollutant Emissions Trends Data.
35 U.S. Environmental Protection Agency – Regulations to Reduce Mobile Source Pollution.
36 U.S. Environmental Protection Agency – Ambient Concentrations of Benzene.
37 HDR: Los Angeles Skyline. Flickr user Al Pavangkanan. Reproduced according to a CC BY 2.0 license.
38 U.S. Environmental Protection Agency – Air Pollution: Current and Future Challenges.
39 U.S. Environmental Protection Agency – Benefits and Costs of the Clean Air Act 1990-2020, the Second Prospective Study.
Part 19: Methane Emissions in the Oil and Gas Industry
1 U.S. Environmental Protection Agency – Greenhouse Gas Emissions: Overview of Greenhouse Gases.
2 U.S. Energy Information Administration – Electric Power Monthly, Table 1.1 – Net Generation by Energy Source: Total (All Sectors), 2007-December 2017.
3 National Energy Technology Laboratory (2013). Cost and Performance Baseline for Fossil Energy Plants, Volume 1: Bituminous Coal and Natural Gas to Electricity, Revision 2a, September 2013.
4 U.S. Environmental Protection Agency (2017). Inventory of U.S. Greenhouse Gas Emissions and Sinks: 1990-2015.
5 Schmidt, G. (2004). Methane: A Scientific Journey from Obscurity to Super-Stardom. NASA Research Features.
6 United Nations Framework Convention on Climate Change – National Reports.
7 U.S. Environmental Protection Agency – Greenhouse Gas Reporting Program (GHGRP).
8 U.S. Environmental Protection Agency (2013). Petroleum and Natural Gas Systems: 2011 Data Summary.
9 Heath, G. et al. (2015). Estimating U.S. Methane Emissions from the Natural Gas Supply Chain: Approaches, Uncertainties, Current Estimates, and Future Studies. Joint Institute for Strategic Energy Analysis, Technical Report NREL/TP-6A50-62820.
10 Zavala-Araiza, D. et al. (2015). Toward a Functional Definition of Methane Super-Emitters: Application to Natural Gas Production Sites. Environ. Sci. Technol., 49(13), 8167-8174.
11 Lattanzio, R.K. (2018). Methane and Other Air Pollution Issues in Natural Gas Systems. Congressional Research Service Report R42986
12 “EDF Announces Satellite Mission to Locate and Measure Methane Emissions.” Environmental Defense Fund Press Release, Apri l 11, 2018.
13 U.S. Environmental Protection Agency – U.S. Greenhouse Gas Inventory Report Archive.
14 Environmental Defense Fund (2017) – Methane Research: The 16 Study Series.
15 Lyon, D. et al. (2016). Aerial Surveys of Elevated Hydrocarbon Emissions from Oil and Gas Production Sites. Environ. Sci. Technol., 50(9), 4877-4886.
16 Townsend-Small, A. et al. (2015). Integrating Source Apportionment Tracers into a Bottom-up Inventory of Methane Emissions in the Barnett Shale Hydraulic Fracturing Region. Environ. Sci. Technol., 49(13), 8175-8182.
17 Zavala-Araiza, D. et al. (2015). Reconciling divergent estimates of oil and gas methane emissions. Proc. Natl. Acad. Sci., 112(51), 15597-15602.
Part 20: Mitigating and Regulating Methane Emissions
1 U.S. Environmental Protection Agency – Natural Gas STAR Program: Overview of the Oil and Natural Gas Industry.
2 File:Flaring extra Gas in the Bakken.JPG. Wikimedia Commons user Joshua Doubek. Reproduced according to a CC BY-SA 3.0 license.
3 U.S. Environmental Protection Agency – Understanding Global Warming Potentials.
4 U.S. Environmental Protection Agency – Ozone Pollution.
5 American Petroleum Institute (2017). Natural Gas, Oil Industry Launch Environmental Partnership to Accelerate Reductions in Methane, VOCs. December, 2017.
6 U.S. Environmental Protection Agency – Controlling Air Pollution from the Oil and Natural Gas Industry: New Source Performance Standards and Permitting Requirements.
7 National Conference of State Legislatures (2014). State Methane Policies.
8 International Petroleum Industry Environmental Conservation Association (2014). Green Completions.
9 U.S. Environmental Protection Agency (2012). Overview of Final Amendments to Air Regulations for the Oil and Gas Industry.
10 U.S. Environmental Protection Agency – Actions and Notices about Oil and Natural Gas Air Pollution Standards.
11 U.S. Energy Information Administration (2016). Natural gas flaring in North Dakota has declined sharply since 2014. Today in Energy, June 13, 2016.
12 Roy Luck – Crosstex gas processing facility. Taken on May 9, 2009. Flickr. Reproduced according to a CC BY 2.0 license.
13 U.S. Bureau of Land Management (2016). Waste Prevention, Production Subject to Royalties, and Resource Conservation. Federal Register, 81, p. 83008-83089, November 18, 2016.
14 “EPA Releases First-Ever Standards to Cut Methane Emissions from the Oil and Gas Sector.” U.S. Environmental Protection Agency press release, May 12, 2016.
15 Clark Hill PLC (2017). Court Vacates EPA Stay of Methane Emissions Final Rule. Lexology, September 29, 2017.
16 California Air Resources Board (2017). CARB approves rule for monitoring and repairing methane leaks from oil and gas facilities. News Release #17-18, March 23, 2017.
17 Pennsylvania Department of Environmental Protection – How Pennsylvania is Regulating Methane from the Oil and Gas Industry.
18 U.S. Environmental Protection Agency – EPA’s Voluntary Methane Programs for the Oil and Natural Gas Industry.
19 U.S. Environmental Protection Agency – AgSTAR: Biogas Recovery in the Agricultural Sector.
Part 21: U.S. Regulation of Oil and Gas Operations
1 Railroad Commission of Texas - Railroad Commission Milestones.
2 Interstate Oil & Gas Compact Commission – Our History.
3 U.S. Environmental Protection Agency – Regulatory Information by Sector: Oil and Gas Extraction Sector.
4 U.S. Occupational Safety and Health Administration – OSHA Law & Regulations.
5 Interstate Oil & Gas Compact Commission – Member States.
6 Mapchart.net.
7 Interstate Oil & Gas Compact Commission – Interstate Oil and Gas Commission Charter.
8 Interstate Oil & Gas Compact Commission – Summary of State Statutes and Regulations.
9 Ground Water Protection Council (2009). State Oil and Natural Gas Regulations Designed to Protect Water Resources. Prepared for the U.S. Department of Energy’s National Energy Technology Laboratory, May 2009.
10 U.S. Office of Natural Resources Revenue – Production Data.
11 U.S. Energy Information Administration – Crude Oil Production.
12 U.S. Energy Information Administration – U.S. Dry Natural Gas Production.
13 U.S. Geological Survey – The National Map: Federal Lands and Indian Reservations.
14 U.S. Environmental Protection Agency – Regulatory Information by Sector: Oil and Gas Extraction Sector.
15 U.S. Environmental Protection Agency – Reduced Emission Completions for Hydraulically Fractured Natural Gas Wells.
16 U.S. Environmental Protection Agency – Actions and Notices about Oil and Natural Gas Air Pollution Standards.
17 “Model Advances Analysis of Offshore BOP Closure during Extreme Pressure and Flow Conditions.” U.S. Bureau of Safety and Environmental Enforcement press release, February 17, 2017.
18 U.S. Environmental Protection Agency (2015). Minimizing and Managing Potential Impacts of Injection-Induced Seismicity from Class II Disposal Wells: Practical Approaches.
19 Bureau of Land Management – Oil and Gas: Regulations, Onshore Orders and Notices to Lessees.
20 “BLM Rescinds Rule on Hydraulic Fracturing.” U.S. Bureau of Land Management Press Release, December 28, 2017.
21 National Park Service (2015). Cost-Benefit and Regulatory Flexibility Analyses: U.S. Department of the Interior, National Park Service, Proposed Revisions to 36 CFR Part 9, Subpart B.
22 Electronic Code of Federal Regulations – Title 36, Chapter I, Part 6, Subpart B: Non-Federal Oil and Gas Rights.
23 U.S. Environmental Protection Agency – National Environmental Policy Act.
24 U.S. Bureau of Ocean Energy Management – Outer Continental Shelf.
25 Cameron Jr., B. and Matthews, T. (2016). OCS Regulatory Framework. U.S. Bureau of Ocean Energy Management report BOEM 2016-014.
26 National Academy of Engineering and National Research Council (2012). Macondo Well Deepwater Horizon Blowout: Lessons for Improving Offshore Drilling Safety. Washington, DC: The National Academies Press.
27 U.S. Bureau of Safety and Environmental Enforcement – Regulations.
28 U.S. Pipeline and Hazardous Materials Safety Administration – State Programs Overview.
29 Pless, J. (2011). Making State Gas Pipelines Safe and Reliable: An Assessment of State Policy. National Conference of State Legislatures, March 2011.
30 U.S. Pipeline and Hazardous Materials Safety Administration – Pipeline Technical Resources.
31 U.S. Pipeline and Hazardous Materials Safety Administration – Underground Natural Gas Storage.
32 U.S. Environmental Protection Agency – Clean Air Act Standards and Guidelines for Petroleum Refineries and Distribution Industry.
33 Federal Energy Regulatory Commission – What FERC does.
34 Shea, D. et al. (2015). Transporting Crude Oil by Rail: State and Federal Action. National Conference of State Legislatures, October 30, 2015.
35 Durkay, J. (2017). State Renewable Portfolio Standards and Goals. National Conference of State Legislatures, August 1, 2017.
36 U.S. Environmental Protection Agency – Renewable Fuel Standard Program.
37 U.S. Environmental Protection Agency – Final Renewable Fuel Standards for 2018, and the Biomass-based Diesel Volume for 2019.
38 U.S. Energy Information Administration (2016). Almost all U.S. Gasoline is blended with 10% ethanol. Today in Energy, May 4, 2016.
39 U.S. Fish & Wildlife Service – Endangered Species Act: Overview.
40 Joy, M.P. and Dimitroff, S.D. (2016). Oil and gas regulation in the United States: overview. Westlaw, June 1, 2016.
Part 22: Health and Safety in Oil and Gas Extraction
1 U.S. Bureau of Labor Statistics – Quarterly Census of Employment and Wages. (2017 NAICS codes: 211120, 211130, 213111, and 213112)
2 U.S. Bureau of Labor Statistics – Census of Fatal Occupational Injuries.
3 Mason, K.L. et al. (2015). Occupational Fatalities During the Oil and Gas Boom – United States, 2003-2013. Centers for Disease Control and Prevention, Morbidity and Mortality Weekly Report, 64(2), 551-554.
4 National Institute for Occupational Safety and Health (2010). NIOSH Field Effort to Assess Chemical Exposure Risks to Gas and Oil Workers. Fact Sheet, DHHS (NIOSH) Publication No. 2010-130.
5 Kiefer, M. (2013). NIOSH Safety and Health Research in Oil and Gas Extraction. Board of Scientific Counselors Meeting, September 18, 2013.
6 Esswein et al. (2013). Occupational Exposures to Respirable Crystalline Silica During Hydraulic Fracturing. J. Occup. Environ. Hyg., 10(7), 347-356.
7 NIOSH Research Rounds – Investigators Design Experimental Engineering Control for Silica Dust.
8 National Institute for Occupational Safety and Health – Silica.
9 Occupational Safety and Health Administration (2012). OSHA-NIOSH Hazard Alert: Worker Exposure to Silica During Hydraulic Fracturing.
10 Occupational Safety and Health Administration – Frequently Asked Questions: Respirable Crystalline Silica Rule.
11 National Institute for Occupational Safety and Health (2016). NIOSH-OSHA Hazard Alert: Health and Safety Risks for Workers Involved in Manual Tank Gauging and Sampling at Oil and Gas Extraction Sites.
12 California Department of Public Health and National Institute for Occupational Safety and Health (2017). Protecting Oil and Gas Workers from Hydrocarbon Gases and Vapors. Video Pub. No. 2017-158D.
13 Occupational Safety and Health Administration – Occupational Noise Exposure.
14 Occupational Safety and Health Administration – Occupational Safety and Health Standards: Air Contaminants. Standard Number 1910.1000.
15 International Agency for Research on Cancer (2012). Chemical Agents and Related Occupations. IARC Monographs on the Evaluation of Carcinogenic Risks to Humans, Volume 100F.
16 Occupational Safety and Health Administration - Hazard Communication Standard: Safety Data Sheets.
17 NORA Oil and Gas Extraction Council, National Institute for Occupational Safety and Health.
18 American Petroleum Institute – Occupational Health and Safety in the Industry.
19 Association of Energy Service Companies - Industry Resources.
20 International Association of Drilling Contractors – Health, Safety, and Environmental Case Guidelines.
21 National STEPS Network.
Part 23: Subsurface Data in the Oil and Gas Industry
1 U.S. Energy Information Administration (2016). Trends in U.S. Oil and Natural Gas Upstream Costs.
2 Bureau of Ocean Energy Management – Record of Decision, Atlantic OCS Region Geological and Geophysical Activities.
3 Varhaug, M. (2016). Basic Well Log Interpretation. The Defining Series, Oilfield Review.
4 Schlumberger – 1920s: The First Well Log.
5 AAPGWiki – Overview of Routine Core Analysis.
6 Zihlman, F.N. et al. (2000). Selected Data from Fourteen Wildcat Wells in the National Petroleum Reserve in Alaska. USGS Open File Report 00-200. Core from the well “East Simpson 2”, Image no. 0462077.
7 Society of Petroleum Engineers PetroWiki – Petrophysics.
8 “Big Data Growth Continues in Seismic Surveys.” K. Boman, Rigzone, September 2, 2015.
9 U.S. Geological Survey Core Research Center – Frequently Asked Questions.
10 Kansas Geological Society & Library – Oil and Gas Well Data.
11 Akintomide, A.O. and Dawers, N.H. (2016). Structure of the Northern Margin of the Terrebonne Trough, Southeastern Louisiana: Implications for Salt Withdrawal and Miocene to Holocene Fault Activity. Geological Society of America Abstracts with Programs, 48(7), Paper No. 244-2.
12 Shaw, J. and Shearer, P. (1999). An Elusive Blind-Thrust Fault Beneath Metropolitan Los Angeles. Science, 283, 1516-1518.