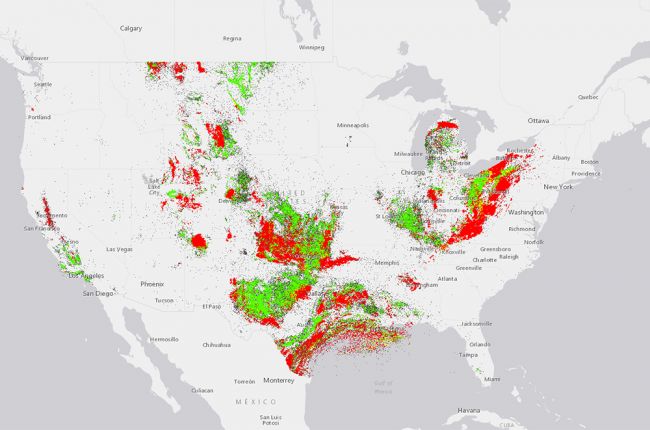
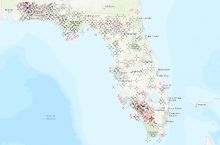
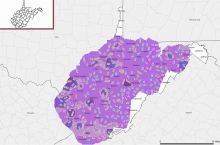
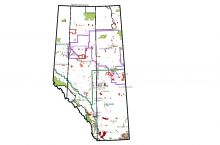
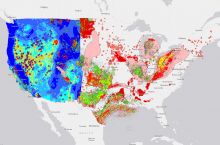
The U.S. Geological Survey provides an interactive map of historical oil and gas production in the United States from 1859 to 2005, including Alaska and Hawaii. In this map, the country is split into quarter-mile cells and the production status of all wells in that cell are aggregated for each time period.
The map can be filtered to show oil and gas production pre-1900, for each decade of the 20th century, and for 2000-2005.
All of the data can be downloaded for further use and analysis.
Click here to access the interactive map.
Source: U.S. Geological Survey

