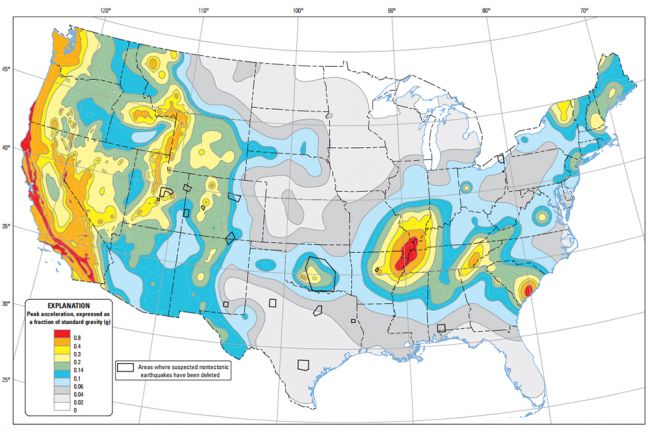
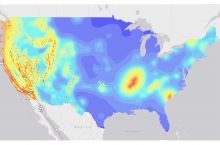
Ground shaking is the most powerful predictor of damage from an earthquake. The U.S. Geological Survey (USGS) National Seismic Hazard Map shows the strength of ground shaking that has a 1 in 50 chance of being exceeded in a particular place in the lower 48 states over a period of 50 years. These maps are used in determining building seismic codes, insurance rates, and other public decisions.
The amount of shaking an earthquake produces at a particular place depends not only on the earthquake's size, but also local characteristics like the bedrock type and soil type. For information about specific risks in your local area, contact your state geological survey or regional earthquake consortium:
- California, Oregon, Washington: Cascadia Region Earthquake Workgroup: CREW
- Midwest: Central United States Emergency Consortium: CUSEC
- Northeast: Northeast States Emergency Consortium: NESEC
- Western (including AK, HI, Cascades): Western States Seismic Policy Council: WSSPC
Click here to access the National Seismic Hazard maps
Note: Beginning in 2016, the U.S. Geological Survey has produced an annual seismic hazard map for the central and eastern United States that includes induced earthquakes. Click here to access the latest map that includes induced earthquake hazards.
Source: U.S. Geological Survey Seismic Hazard Maps and Data (2014). See here for older maps for Alaska, Hawaii, and U.S. territories. USGS scientists update these maps as they get more data and their knowledge about earthquake hazards improves. They released this map for the lower 48 states in 2014.


