Spill types, numbers, sizes, effects, and mitigation/cleanup efforts
Introduction
Oilfield spills can harm wildlife and pose a risk to human health if they reach fresh water sources or contaminate soil or air. The enormous size of the oil and gas industry and the huge volumes of oil and produced water that are handled, stored, and transported result in thousands of spills every year.1,2,3 But not all spills are created equal: the size, location, and type of spill, and how quickly the spill can be cleaned up, all influence the overall environmental impact.
Spills occur in two main settings: at or near the well site, or in transit between the oilfield, refineries, and consumers. Spills in the oilfield are usually smaller4 and easier to clean up than those related to bulk transportation: drill sites are purpose-built “pads” made of gravel and other materials designed to deter spills from reaching soil or groundwater; additional containment measures are used around liquid storage tanks or pits to help contain spills; and equipment and personnel are commonly on hand to address spills quickly.
Other parts of this series provide more information on spills related to transportation and offshore oil and gas production. Spill cleanup in the ocean is particularly complex and is not addressed in detail in this series. Instead, we refer the interested reader to the excellent introductory resources provided by the National Oceanic and Atmospheric Administration – see “References" and "More Resources” at the end of this section for more information.5 Spill cleanup on land is described in this section as similar methods are used both on and off the oilfield.
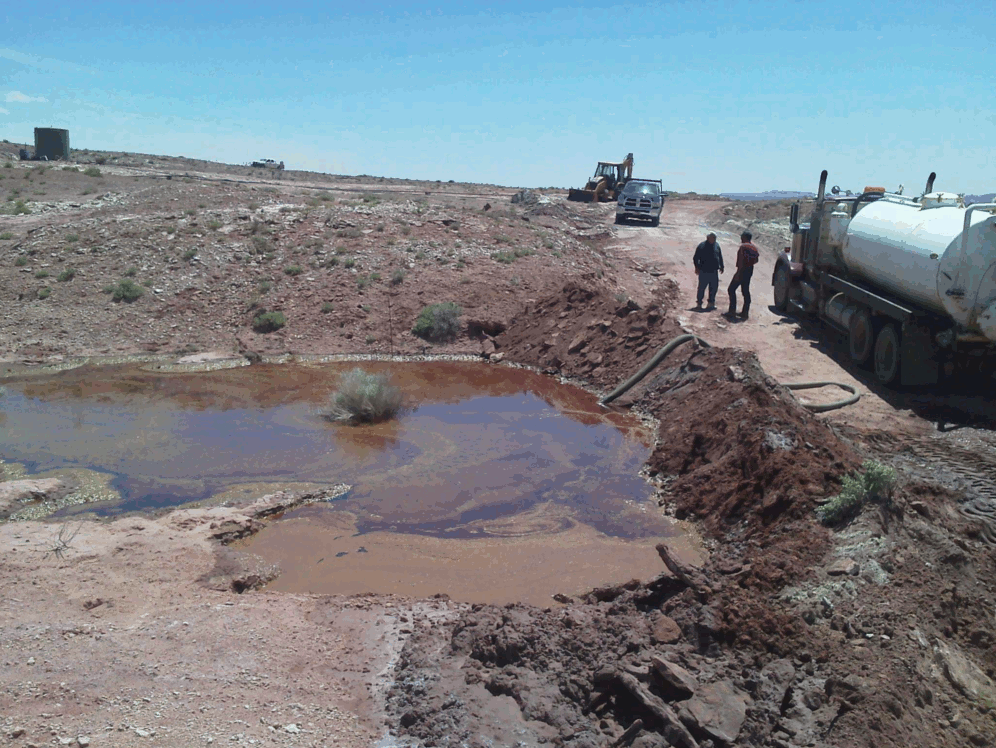
Spill from a leaking oil well in the Salt Wash oilfield, Utah, 2014. Image credit: U.S. Bureau of Land Management.6
Number and Size of Spills
Spill data for different states are difficult to compare because each state has different reporting requirements based on the volume, type of material, location, and spread of the spill. A study of over 31,000 horizontal, hydraulically fractured wells in Colorado, New Mexico, North Dakota, and Pennsylvania from 2005-2014 found that, on average, there were 55 reported oilfield spills per 1000 wells per year.2 Most spills are small: the median reported spill size was 120 gallons in Pennsylvania, 210 gallons in North Dakota, 798 gallons in Colorado, and 1,302 gallons in New Mexico (note again that state numbers should not be directly compared because of different reporting requirements in each state). Roughly half of all spills documented in this study came from storage tanks, storage pits, or the pipes that transport used drilling fluid around and away from a drill rig. Most spills involved produced water (the naturally occurring water – sometimes very salty – that is present in oil and gas reservoirs and so is extracted along with the oil/gas); in some cases this can include flowback of hydraulic fracturing fluid. The same study found that 75–94% of spills occurred during the first three years of a well’s life. This is the time during which a well is drilled, hydraulically fractured, and has the highest production rate. These factors result in larger volumes of fluids being stored, handled, and transported, all of which increase the risk of a spill.
A U.S. Environmental Protection Agency (EPA) assessment of spill data from January 2006 to April 2012 studied 36,000 spills from state and industry data sources in an attempt to identify spills specifically related to the hydraulic fracturing process. Of the 36,000 spills studied, roughly 24,000 were unrelated to hydraulic fracturing, 12,000 had insufficient data to make this determination, and 457 spills were documented as directly related to hydraulic fracturing.7 Of these 457 spills, 40% were smaller than 500 gallons and 5% were larger than 10,000 gallons; half consisted of flowback and produced water; and almost half were from storage tanks or pits. The most common cause of spills was human error.
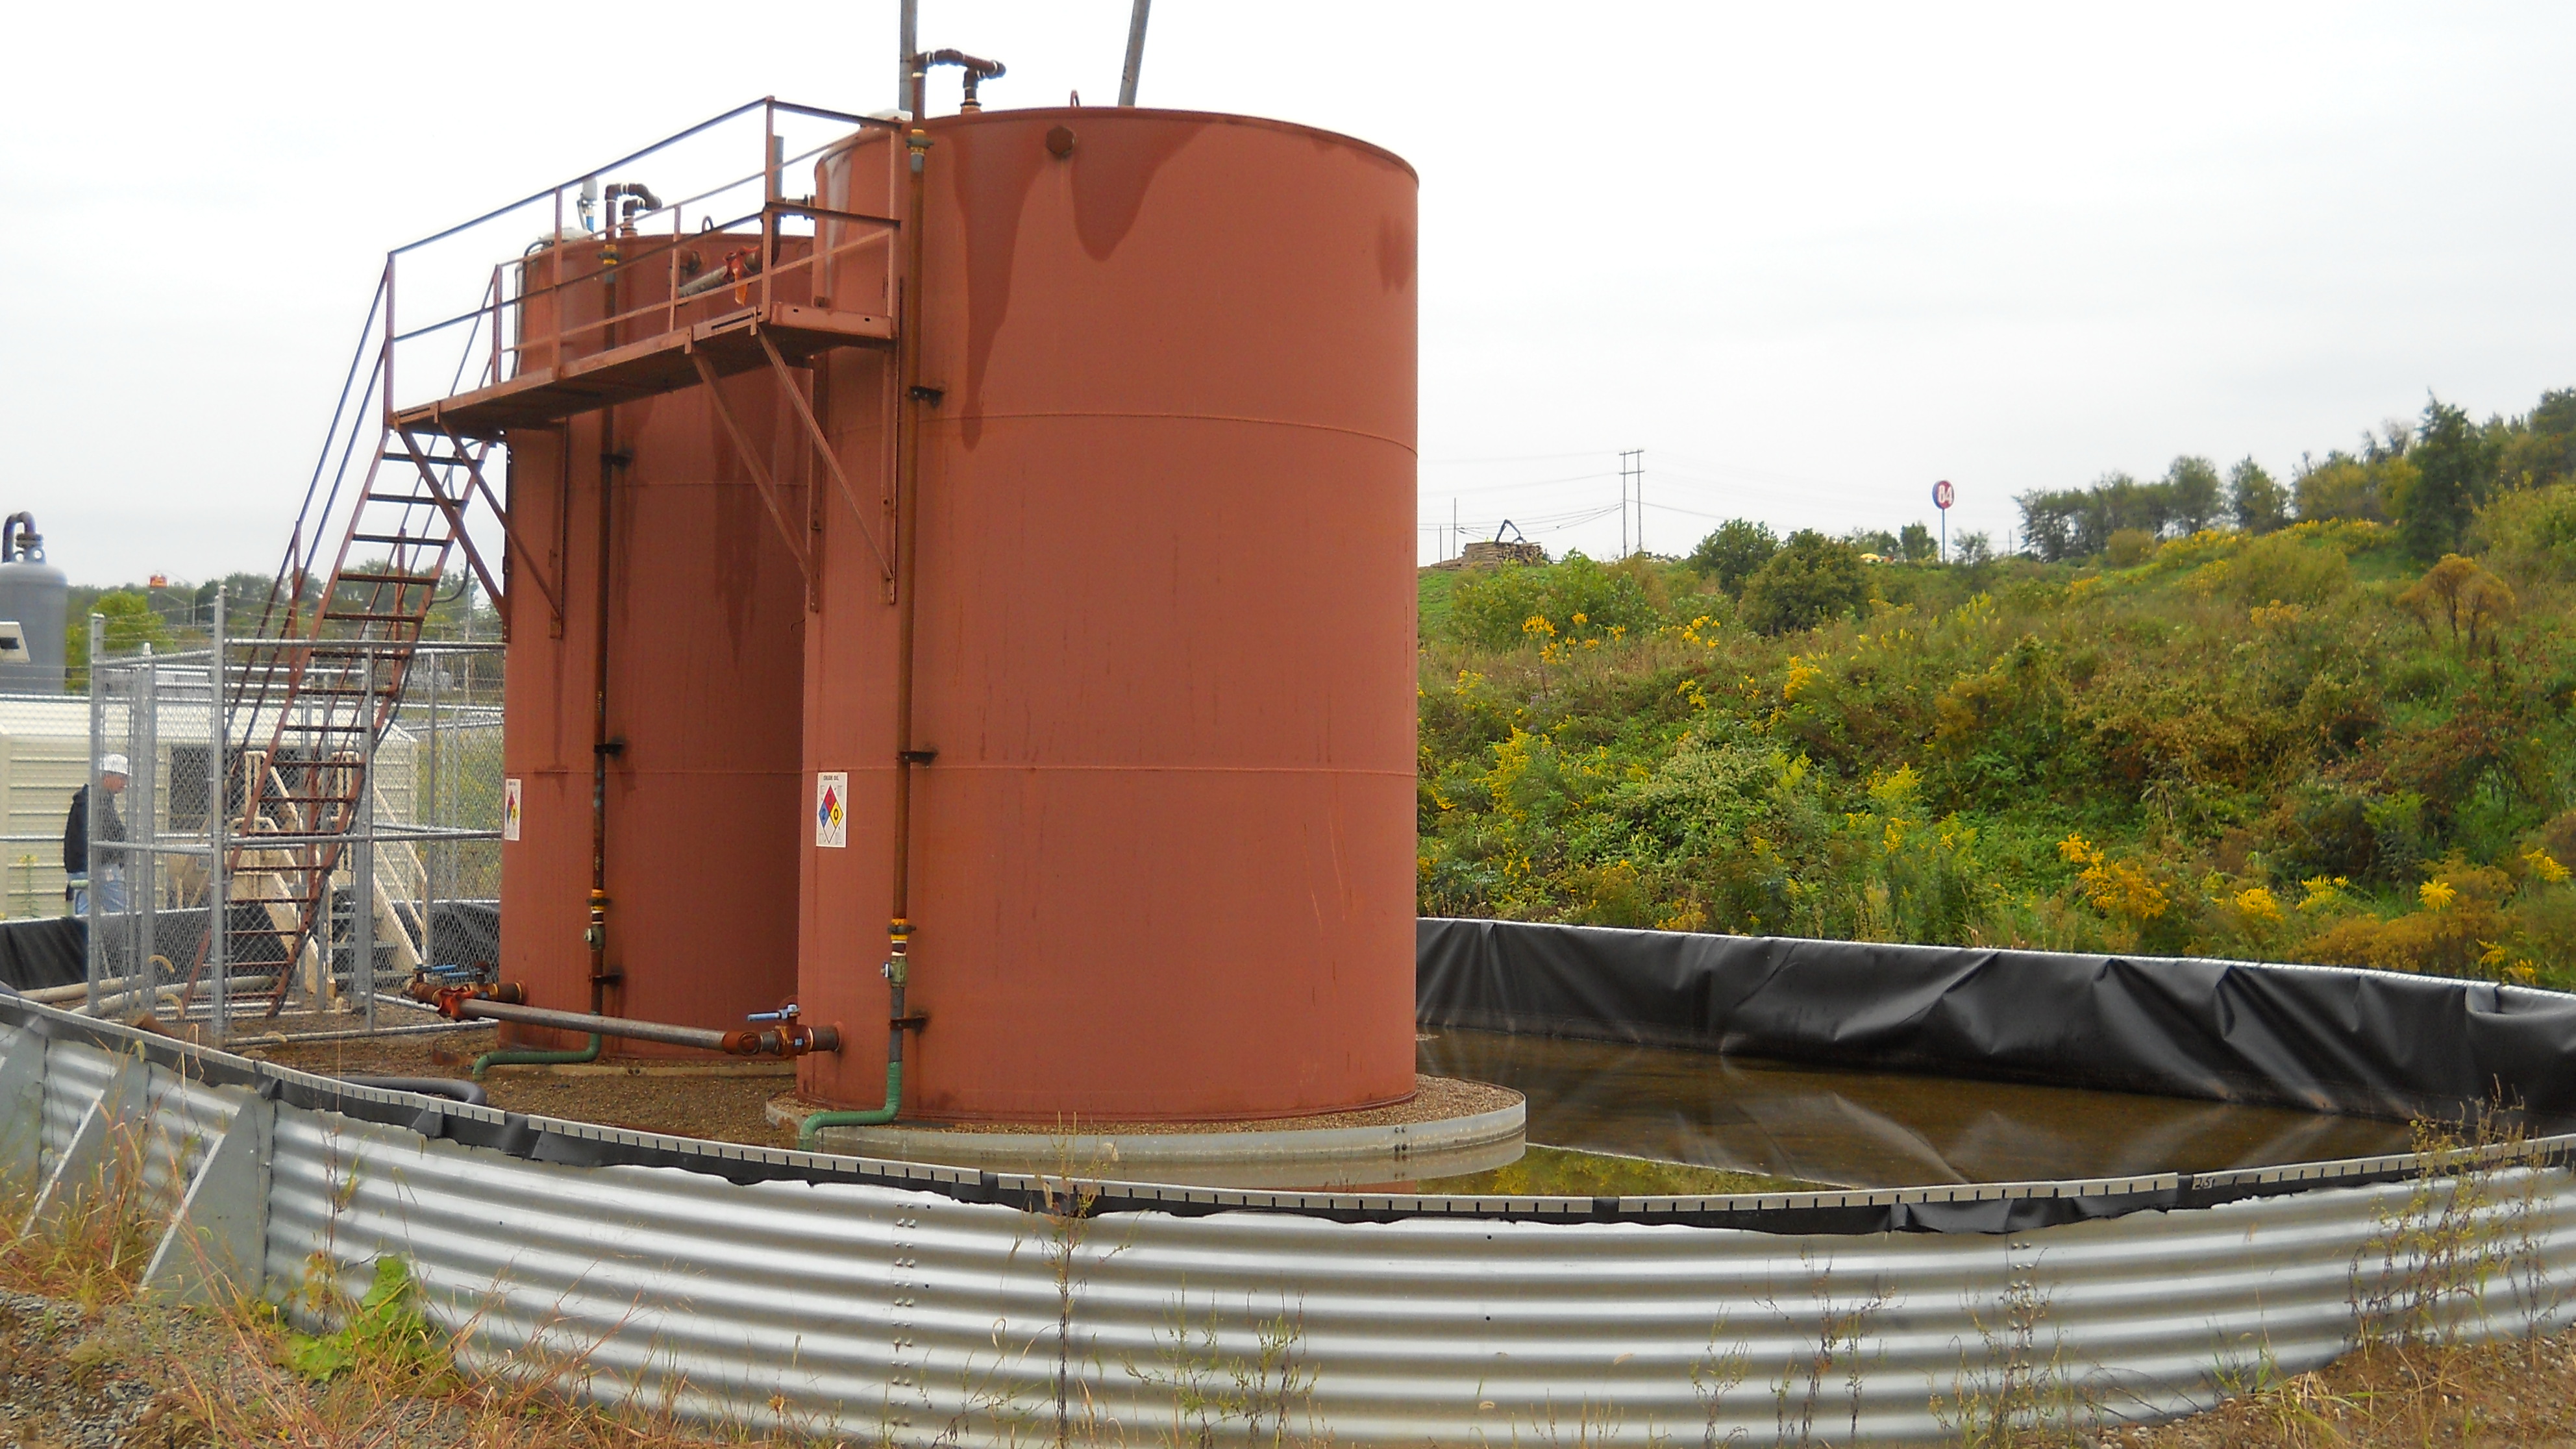
Storage tanks for produced water from natural gas drilling in the Marcellus Shale of Western Pennsylvania are surrounded by spill-containment structures. Storage tanks are one of the main sources of oil- and gas-field spills. Image credit: Doug Duncan, U.S. Geological Survey.12
What is Being Spilled?
Many different fluids are handled in the oilfield. The most commonly spilled fluid is produced water (sometimes including flowback of hydraulic fracturing fluid). Other commonly spilled fluids include crude oil, fluids to be used for hydraulic fracturing, and drilling waste (slurries of rock chips and drilling mud produced during drilling).8 For more information on the composition and handling of produced water, see “Using Produced Water” in this series. For detailed information on the composition of hydraulic fracturing fluids, the FracFocus database provides a registry of fluid compositions used in over 120,000 wells across the United States since 2011.9
Environmental Impacts of Spills
The environmental impact of a spill depends strongly on the size, location, type of fluid, and spread of the spill, including whether or not it contaminates ground- or surface water, which allows it to spread further and makes cleanup more difficult:
- Spilled oil or refined fuel can coat plants, soils, microbes, and animals. Oil prevents plant growth and hinders the movement of water, oxygen, and nutrients through soils. Some components of oils and liquid fuels are toxic to plants, animals, and humans.10,11
- Some light oils and refined fuels such as gasoline or diesel may evaporate, releasing toxic fumes that may degrade air quality or pose a fire hazard.
- Highly saline produced water (up to 15 times saltier than seawater) can kill vegetation and prevent plants from growing in contaminated soil.
Spill Prevention and Mitigation
States regulate oil and gas exploration and production operations and specify spill reporting and cleanup requirements. In addition, the EPA oversees the reporting and cleanup of spills that impact inland waters of the United States. The U.S. Coast Guard is the lead response agency for coastal waters and ports.
Some spills are caused by technical failures, but the most common cause of oilfield spills is human error. Safe and effective operating procedures are therefore an important part of spill prevention. All operators at sites that could potentially discharge oil into or near navigable waters are required by the EPA (or state regulators delegated by the EPA) to implement Spill Prevention, Control, and Countermeasure (SPCC) plans.13 Equipment monitoring and the development of newer, safer equipment aim to reduce the number of spills due to technical and mechanical failures.
In areas prone to spills, such as wastewater storage tanks, containment methods such as berms and plastic sheeting are used to prevent spills from entering the surrounding environment. Similar measures can be set up quickly around a spill to reduce contamination and speed cleanup.
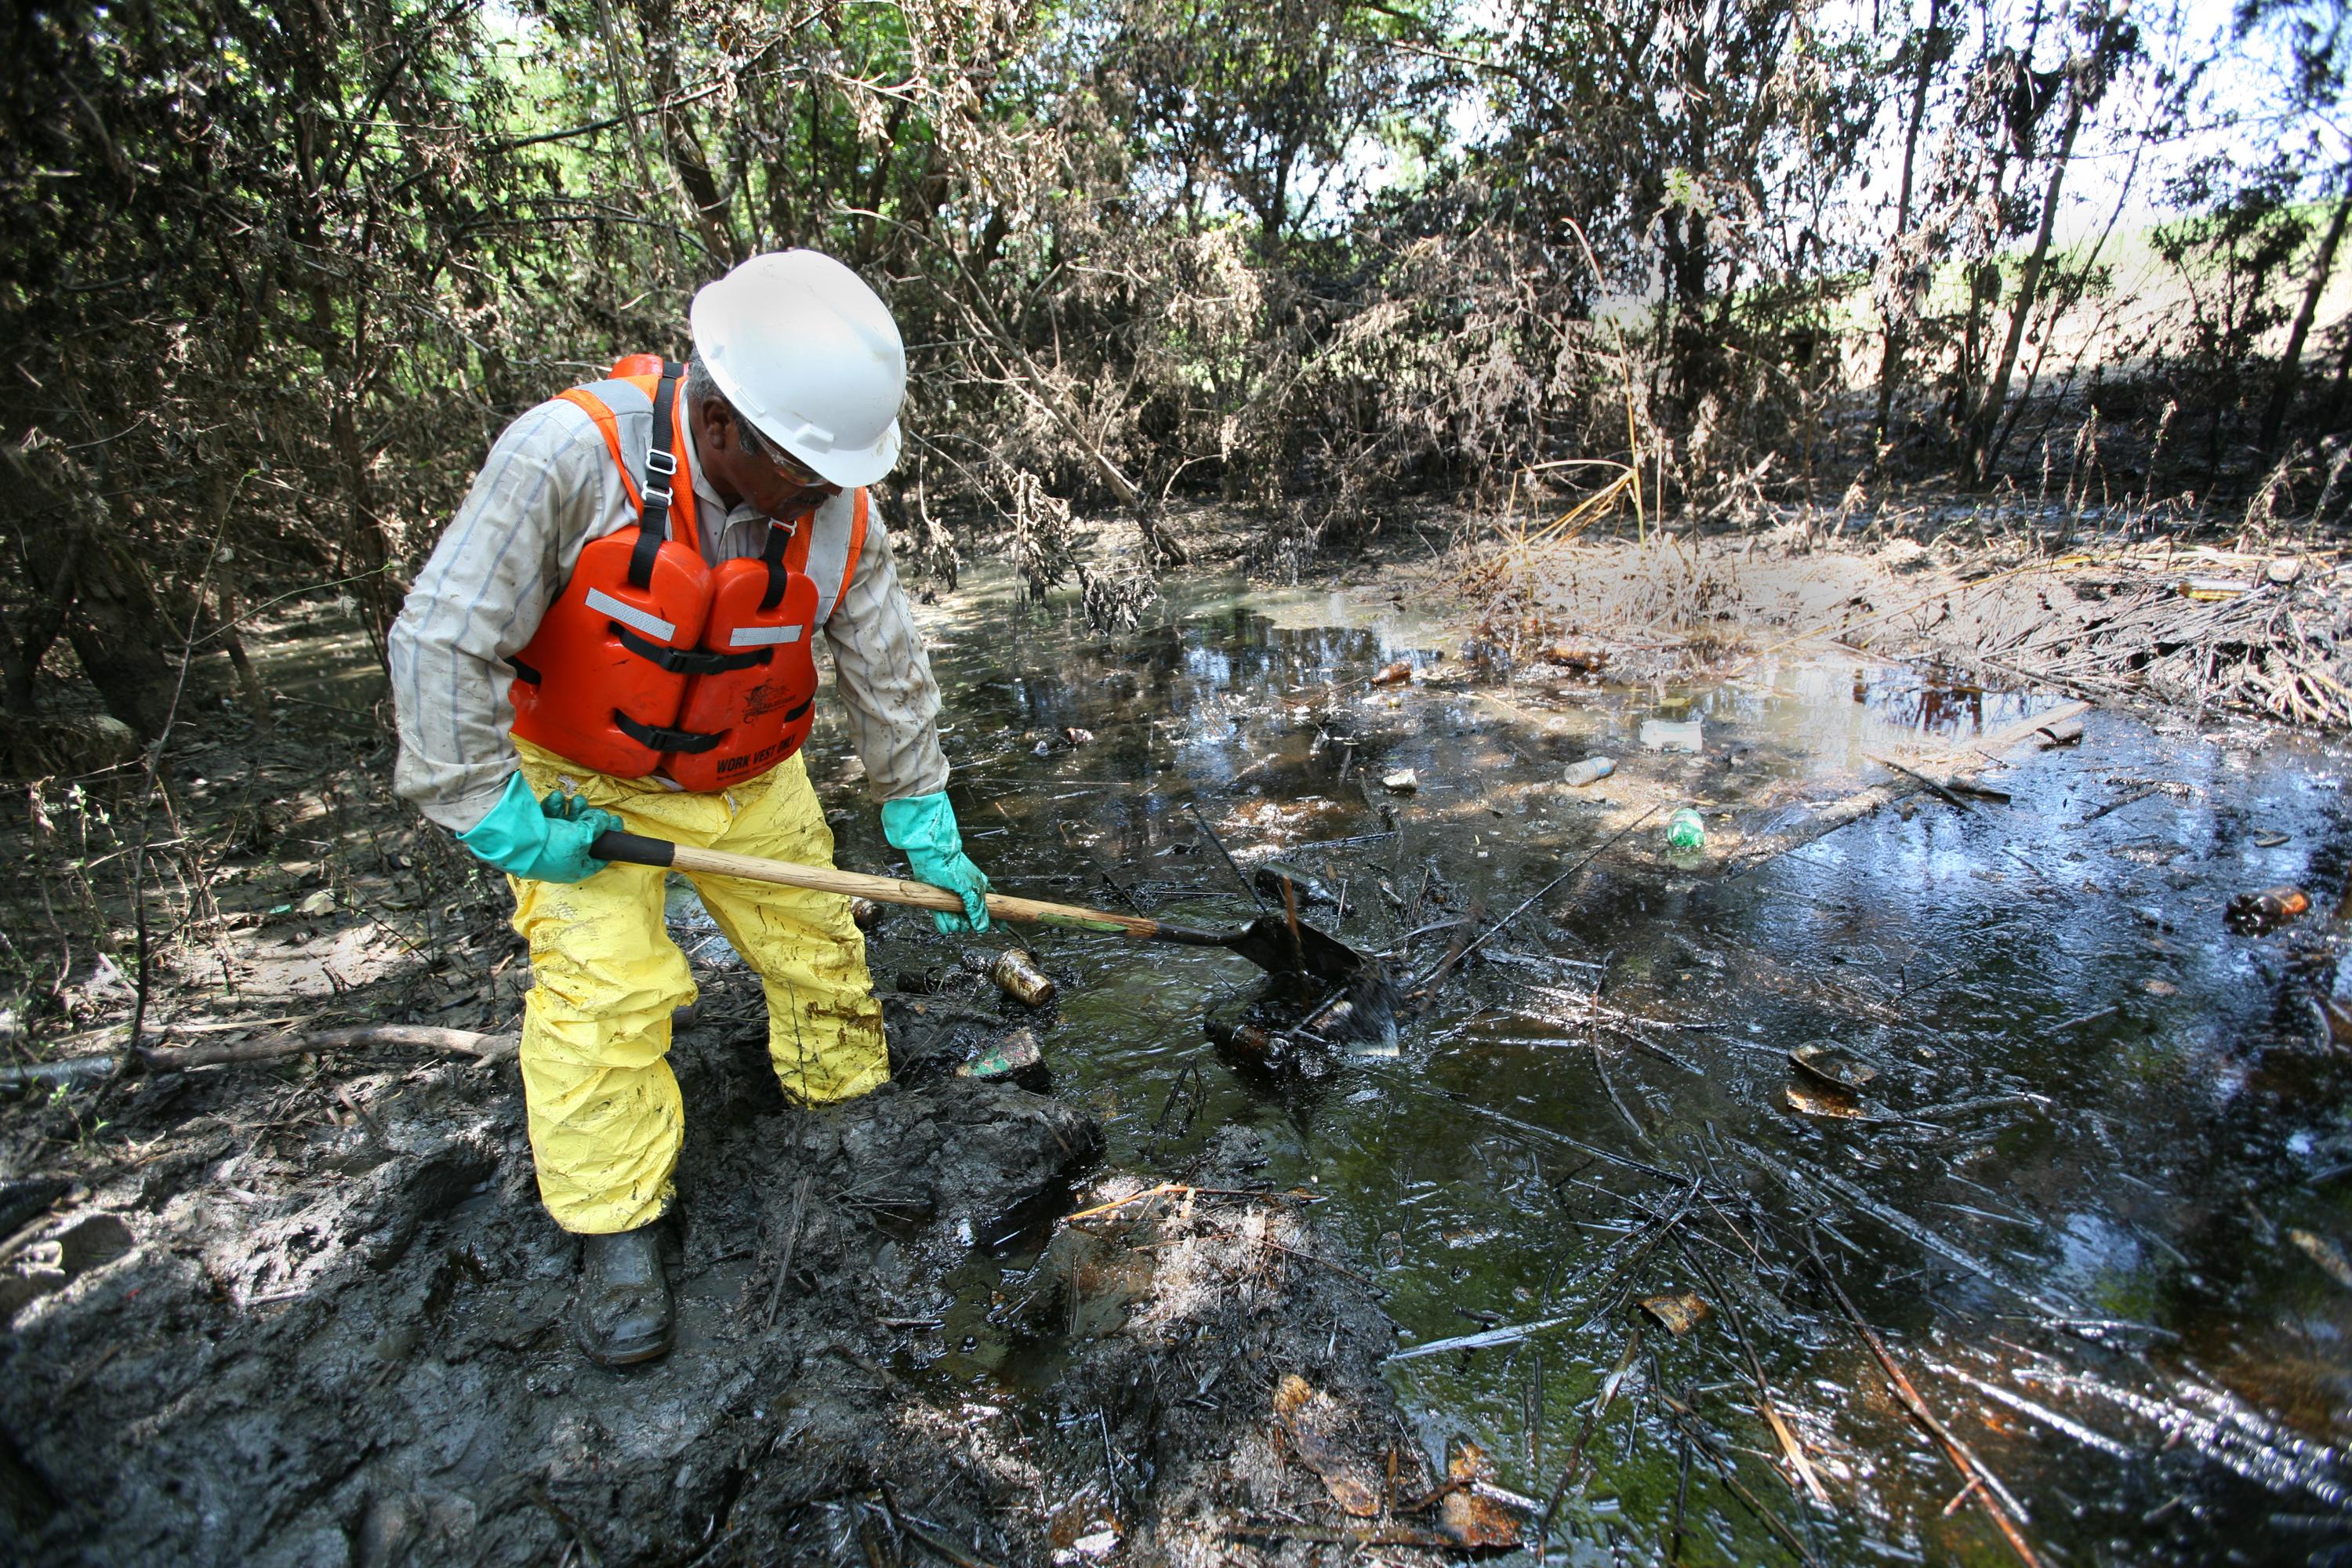
A contractor works to remove oil pools left after a spill from a refinery in Coffeyville, Kansas, contaminated floodwaters of the Verdigris River in 2007. Image credit: Leif Skoogfors/U.S. Federal Emergency Management Agency.15
Oil Spill Cleanup
The first step in oilfield spills is typically to capture spilled fluid using booms, vacuum tanks, or absorbent material, and then to remove any contaminated rocks, plants, and soil.14 If this is done quickly, spilled material can be prevented from spreading further into soil or entering ground- or surface water. Of the 457 spills studied by the EPA from 2006 to 2012, 64% reached the soil, 7% entered surface water, and one spill entered groundwater.14
Oil and refined fuels are degraded by air, sunlight, and bacteria, so for these kinds of spills, fertilizers may be added to spill areas to speed up bacterial activity and more rapidly remediate the spill.16 If an oil spill occurs in a contained area, the oil may be burned off, or the area may be flooded with water so that the oil can float to the water surface for easier removal. Larger animals such as birds, fish, and mammals can be individually collected, cleaned, and treated to prevent toxins from being absorbed through their skin, but this is expensive and has a low success rate.17
In 1979, 420,000 gallons of crude oil spilled from a pipeline in Bemidji, Minnesota. The area has since become the National Crude Oil Spill Research Site, managed by the U.S. Geological Survey’s Toxic Substance Hydrology Program to investigate the effects of a land-based oil spill. Research conducted at this site is used to develop new remediation techniques.18
More detailed information about spill cleanup techniques used by the petroleum industry and their advantages and disadvantages can be found in the American Petroleum Institute’s Oil Spill Prevention and Response Cleanup Toolkit.19
Cleanup crew at the 2015 Blacktail Creek spill, Marmon, North Dakota. This spill was caused by a leaking pipeline that was transporting produced water in the oilfield. Image credit: U.S. Environmental Protection Agency.24
Brine Spill Cleanup
State records do not give details about the composition of spilled water.9 However, the U.S. Geological Survey database of produced waters shows that the majority are saline.20 Saline water spills have long been known to kill existing vegetation and prevent revegetation, which can lead to deep soil erosion.21 Produced water may also contain other toxic components, such as barium, and elevated concentrations of naturally occurring radioactive elements, such as radium.
In January 2015, three million gallons of produced water leaked from a shallow underground pipeline in the Williston Basin, North Dakota.22 The produced water in the pipeline was almost nine times saltier than seawater and contained residual oil. The leak occurred near Blacktail Creek, posing a risk to aquatic life at the site and further downstream. Remediation was conducted by the pipeline operator under the oversight of the North Dakota Department of Health and included:23
- Recovering small quantities of oil from surface water
- Removing up to a foot of soil from several acres around the site
- Impounding Blacktail Creek to allow for the contained collection of contaminated water
- Pumping out potentially contaminated groundwater near Blacktail Creek for several miles downstream
Samples collected four months after the spill showed only slightly elevated salinity levels downstream from the spill. These levels were above background levels but well below the EPA’s drinking water standards. However, some toxic elements (such as barium and radium) stuck to soil particles, reducing the immediate spread of those elements but presenting a longer-term risk if those elements are later remobilized by water passing through the soil. Overall, some minor harm to the creek ecosystem was observed, but fish survival rates appeared to be largely unaffected by the spill, suggesting that the remediation efforts were generally effective.
More Resources
National Oceanic and Atmospheric Administration – How Do Oil Spills out at Sea Typically Get Cleaned Up?
API Energy – Oil Spill Prevention and Response: Toolkit.
Information on research into the composition and risks of oilfield spills is available from the U.S. Geological Survey research program, Understanding the Potential Risks to Water Resources and Environmental Health Associated with Wastes from Unconventional Oil and Gas Development.
For even more detail on the sources, prevention, assessment, cleanup, and economic and legal context of spills, see: Testa, S.M. and Jacobs, J.J (2014). Oil Spills and Gas Leaks: Emergency Response, Prevention, and Cost Recovery. McGraw Hill Publishers, 578 p.
References
1 U.S. Pipeline and Hazardous Materials Safety Administration – Incident Statistics.
2 Patterson, L.A. et al. (2017). Unconventional Oil and Gas Spills: Risks, Mitigation Priorities, and State Reporting Requirements. Environ. Sci. Technol., 51(5), 2563-2573.
3 U.S. Federal Highway Administration – Freight Facts and Figures 2013: Table 5-18. Number and Volume of Oil Spills In and Around U.S. Waterways: 1990, 2000, and 2009-2011.
4 U.S. Bureau of Ocean Energy Management (2013). Oil Spill Occurrence Rates for Alaska North Slope Crude & Refined Oil Spills. Nuka Research & Planning Group, LLC, for BOEM, October 2013. OCS Study BOEM 2013-205.
5 National Oceanic and Atmospheric Administration – How Do Oil Spills out at Sea Typically Get Cleaned Up?
6 Image from U.S. Bureau of Land Management. Accessed at: “Company faces $10K for spill near Green River.” B. Maffly, The Salt Lake Tribune, September 4, 2015.
7 U.S. Environmental Protection Agency (2015). Review of State and Industry Spill Data: Characterization of Hydraulic Fracturing-Related Spills.
8 Maloney, K.O. et al. (2016). Unconventional oil and gas spills: Materials, volumes and risks to surface waters in four states of the U.S.. Sci. Total Environ., 581-582, 369-377.
9 FracFocus Chemical Disclosure Registry.
10 API Energy – Oil Spill Prevention and Response: Land.
11 U.S. Fish & Wildlife Service (2010). Effects of Oil on Wildlife and Habitat. Fact Sheet, June 2010.
12 U.S. Geological Survey – Marcellus Shale Storage Tanks.
13 U.S. Environmental Protection Agency – Oil Spills Prevention and Preparedness Regulations.
14 U.S. Environmental Protection Agency (2015). Review of State and Industry Spill Data: Characterization of Hydraulic Fracturing-Related Spills.
15 U.S. Federal Emergency Management Agency – Oil spill clean up in Kansas.
16 API Energy – Oil Spill Prevention and Response: Land.
17 API Energy – Oil Spill Prevention and Response: Wildlife Cleanup.
18 Minnesota Pollution Control Agency – National Crude Oil Spill Research Site in Bemidji, Minnesota.
19 API Energy – Oil Spill Prevention and Response: Toolkit.
20 U.S. Geological Survey – Produced Waters Database.
21 U.S. Geological Survey (2003). Environmental Impacts of Petroleum Production: Initial Results from the Osage-Skiatook Petroleum Environmental Research Sites, Osage County, Oklahoma. Water-Resources Investigation Report 03-4260.
22 Cozzarelli, I.M. et al. (2017). Environmental signatures and effects of an oil and gas wastewater spill in the Williston Basin, North Dakota. Sci. Total Environ., 579, 1781-1793.
23 U.S. Environmental Protection Agency – Blacktail Creek Spill, Marmon, ND, Region VIII.
24 U.S. Environmental Protection Agency – Blacktail Creek Spill.
Petroleum and the Environment
Download a full PDF of Petroleum and the Environment (free) or purchase a printed version ($19.99).
Other parts in this series:
1. Petroleum and the Environment: an Introduction
2. Water in the Oil and Gas Industry
3. Induced Seismicity from Oil and Gas Operations
4. Water Sources for Hydraulic Fracturing
5. Using Produced Water
6. Groundwater Protection in Oil and Gas Production
7. Abandoned Wells
8. What Determines the Location of a Well?
9. Land Use in the Oil and Gas Industry
10. The Pinedale Gas Field, Wyoming
11. Heavy Oil
12. Oil and Gas in the U.S. Arctic
13. Offshore Oil and Gas
14. Spills in Oil and Natural Gas Fields
15. Transportation of Oil, Gas, and Refined Products
16. Oil Refining and Gas Processing
17. Non-Fuel Products of Oil and Gas
18. Air Quality Impacts of Oil and Gas
19. Methane Emissions in the Oil and Gas Industry
20. Mitigating and Regulating Methane Emissions
21. Regulation of Oil and Gas Operations
22. Health and Safety in Oil and Gas Extraction
23. Subsurface Data in the Oil and Gas Industry
24. Geoscientists in Petroleum and the Environment
Glossary of Terms
References


