The methods, volumes, risks, and regulation of oil and gas transportation
Introduction
The U.S. has millions of miles of oil and gas pipelines, thousands of rail cars, vessels, and barges, and about 100,000 tanker trucks that move oil and gas from wells to processing facilities or refineries, and finally to consumers. The U.S. also imports and exports large volumes of oil, refined products, and natural gas by pipeline and ship. This vast transportation web includes regional and national storage sites for crude oil, heating oil, gasoline, and natural gas, which help with unexpected demand or delivery interruptions.
Across the U.S., natural gas is transported almost entirely by pipeline, and over 90% of crude oil and refined petroleum products are transported by pipeline at some point. If you have gas-powered heat in your home, there are almost certainly gas distribution lines running down your street and into your house. If you live in a large city or a major oil-producing region, there are almost certainly oil and/or gas transmission pipelines in your area. Pipelines are all around us; like water pipes or electricity lines, they form a critical part of our national infrastructure and generally operate without most people noticing.
When pipelines are well constructed and maintained, spills and leaks are very rare, but no transportation system is 100% safe. Oil spills on land can have significant local impacts; spills in the ocean can have regional impacts; and gas leaks emit methane, which is a potent greenhouse gas and contributor to ozone pollution. Spills and leaks also waste resources (and therefore money), so there are environmental, public health, and economic incentives for maintaining a safe and efficient transportation system for our energy resources.
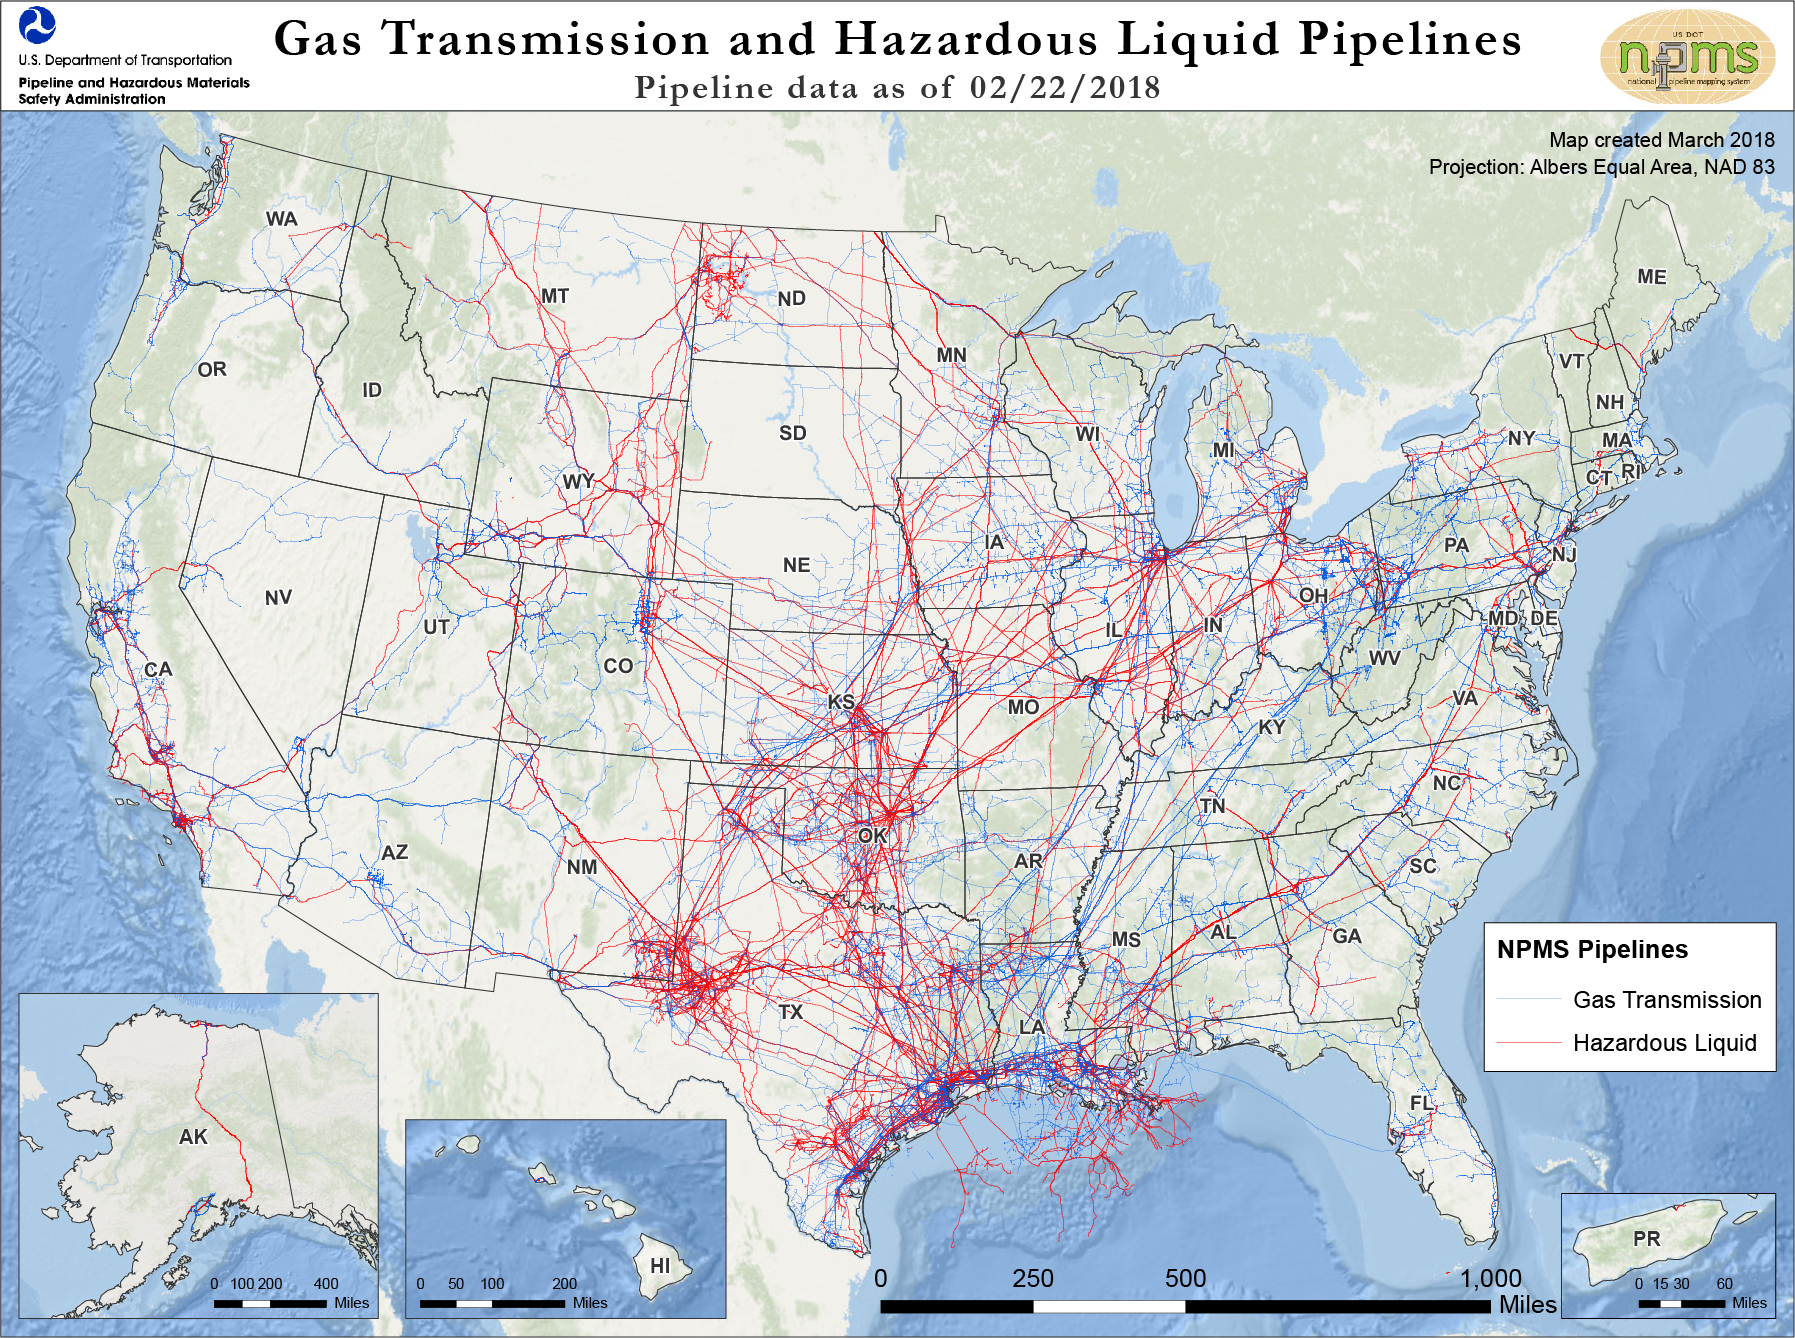
Gas transmission (blue) and hazardous liquid (red) pipelines in the United States as of March 2018. Image does not include gas distribution lines. Hazardous liquid pipelines are mostly those used for crude oil, refined products, and other petroleum liquids, but also include pipelines used to transport ammonia and carbon dioxide. Image credit: Pipeline and Hazardous Materials Safety Administration.1
Pipelines
The U.S. has over 200,000 miles of pipeline for crude oil, refined products, and natural gas liquids. There are over 300,000 miles of pipeline for gathering and transmitting natural gas, and 2.2 million miles for distributing gas to homes, businesses, and other industrial sites.2
In 2014, U.S. pipelines transported almost all of the natural gas produced and used in the United States, as well as over 16 billion barrels of crude oil and refined products3 (this number is about twice the total U.S. consumption of crude oil and refined products because they are transported multiple times between well, refinery, and retail outlet4).
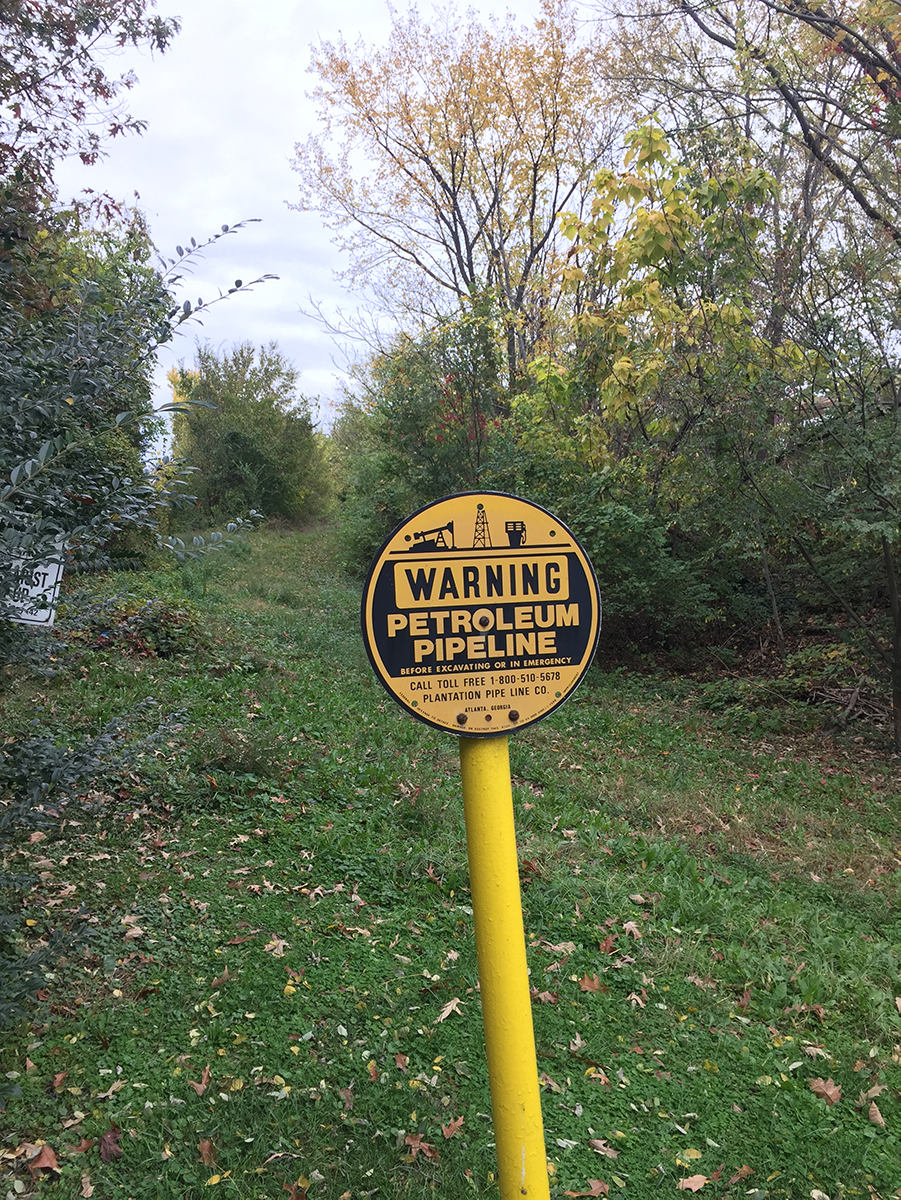
Except for above-ground shut-off valves, most pipelines are buried and marked by signs that warn against digging, identify the line location, and provide emergency contact information in case of a leak or spill.
Sign indicating a buried refined-product pipeline in Alexandria, Virginia. The Plantation Pipeline runs from Gulf Coast refineries to Northern Virginia; the pipeline shown in this picture is an extension of the Plantation Pipeline that delivers jet fuel to Washington National Airport. Image credit: Ben Mandler, American Geosciences Institute.
Rail
In 2017, roughly 140 million barrels of crude oil were transported by rail in the United States, a 64% decrease compared to 2014 volumes.5 This decline was due to the opening of new crude oil pipelines and fewer shipments from the Midwest to the East Coast as coastal refineries imported more crude oil.6 Crude oil imports by rail from Canada were about 48 million barrels in 2017.7
Trucks
In 2013, trucks carried about 1.2 billion tons (about 380 billion gallons or 9 billion barrels) of gasoline, diesel, and aviation fuel.8 Many of the shipments were from refineries or bulk storage facilities to over 160,000 retail outlets.9 Trucks are the most versatile form of transportation because they don’t rely on the presence of pipelines, railways, or water. As a result, they are used for most short-distance transportation of oil and refined products. However, trucks are not particularly energy-efficient, requiring three times as much energy as a train (which is itself less efficient than a barge or pipeline) to move the same amount of material,10 so trucks are less attractive for long-distance transportation.
Barges
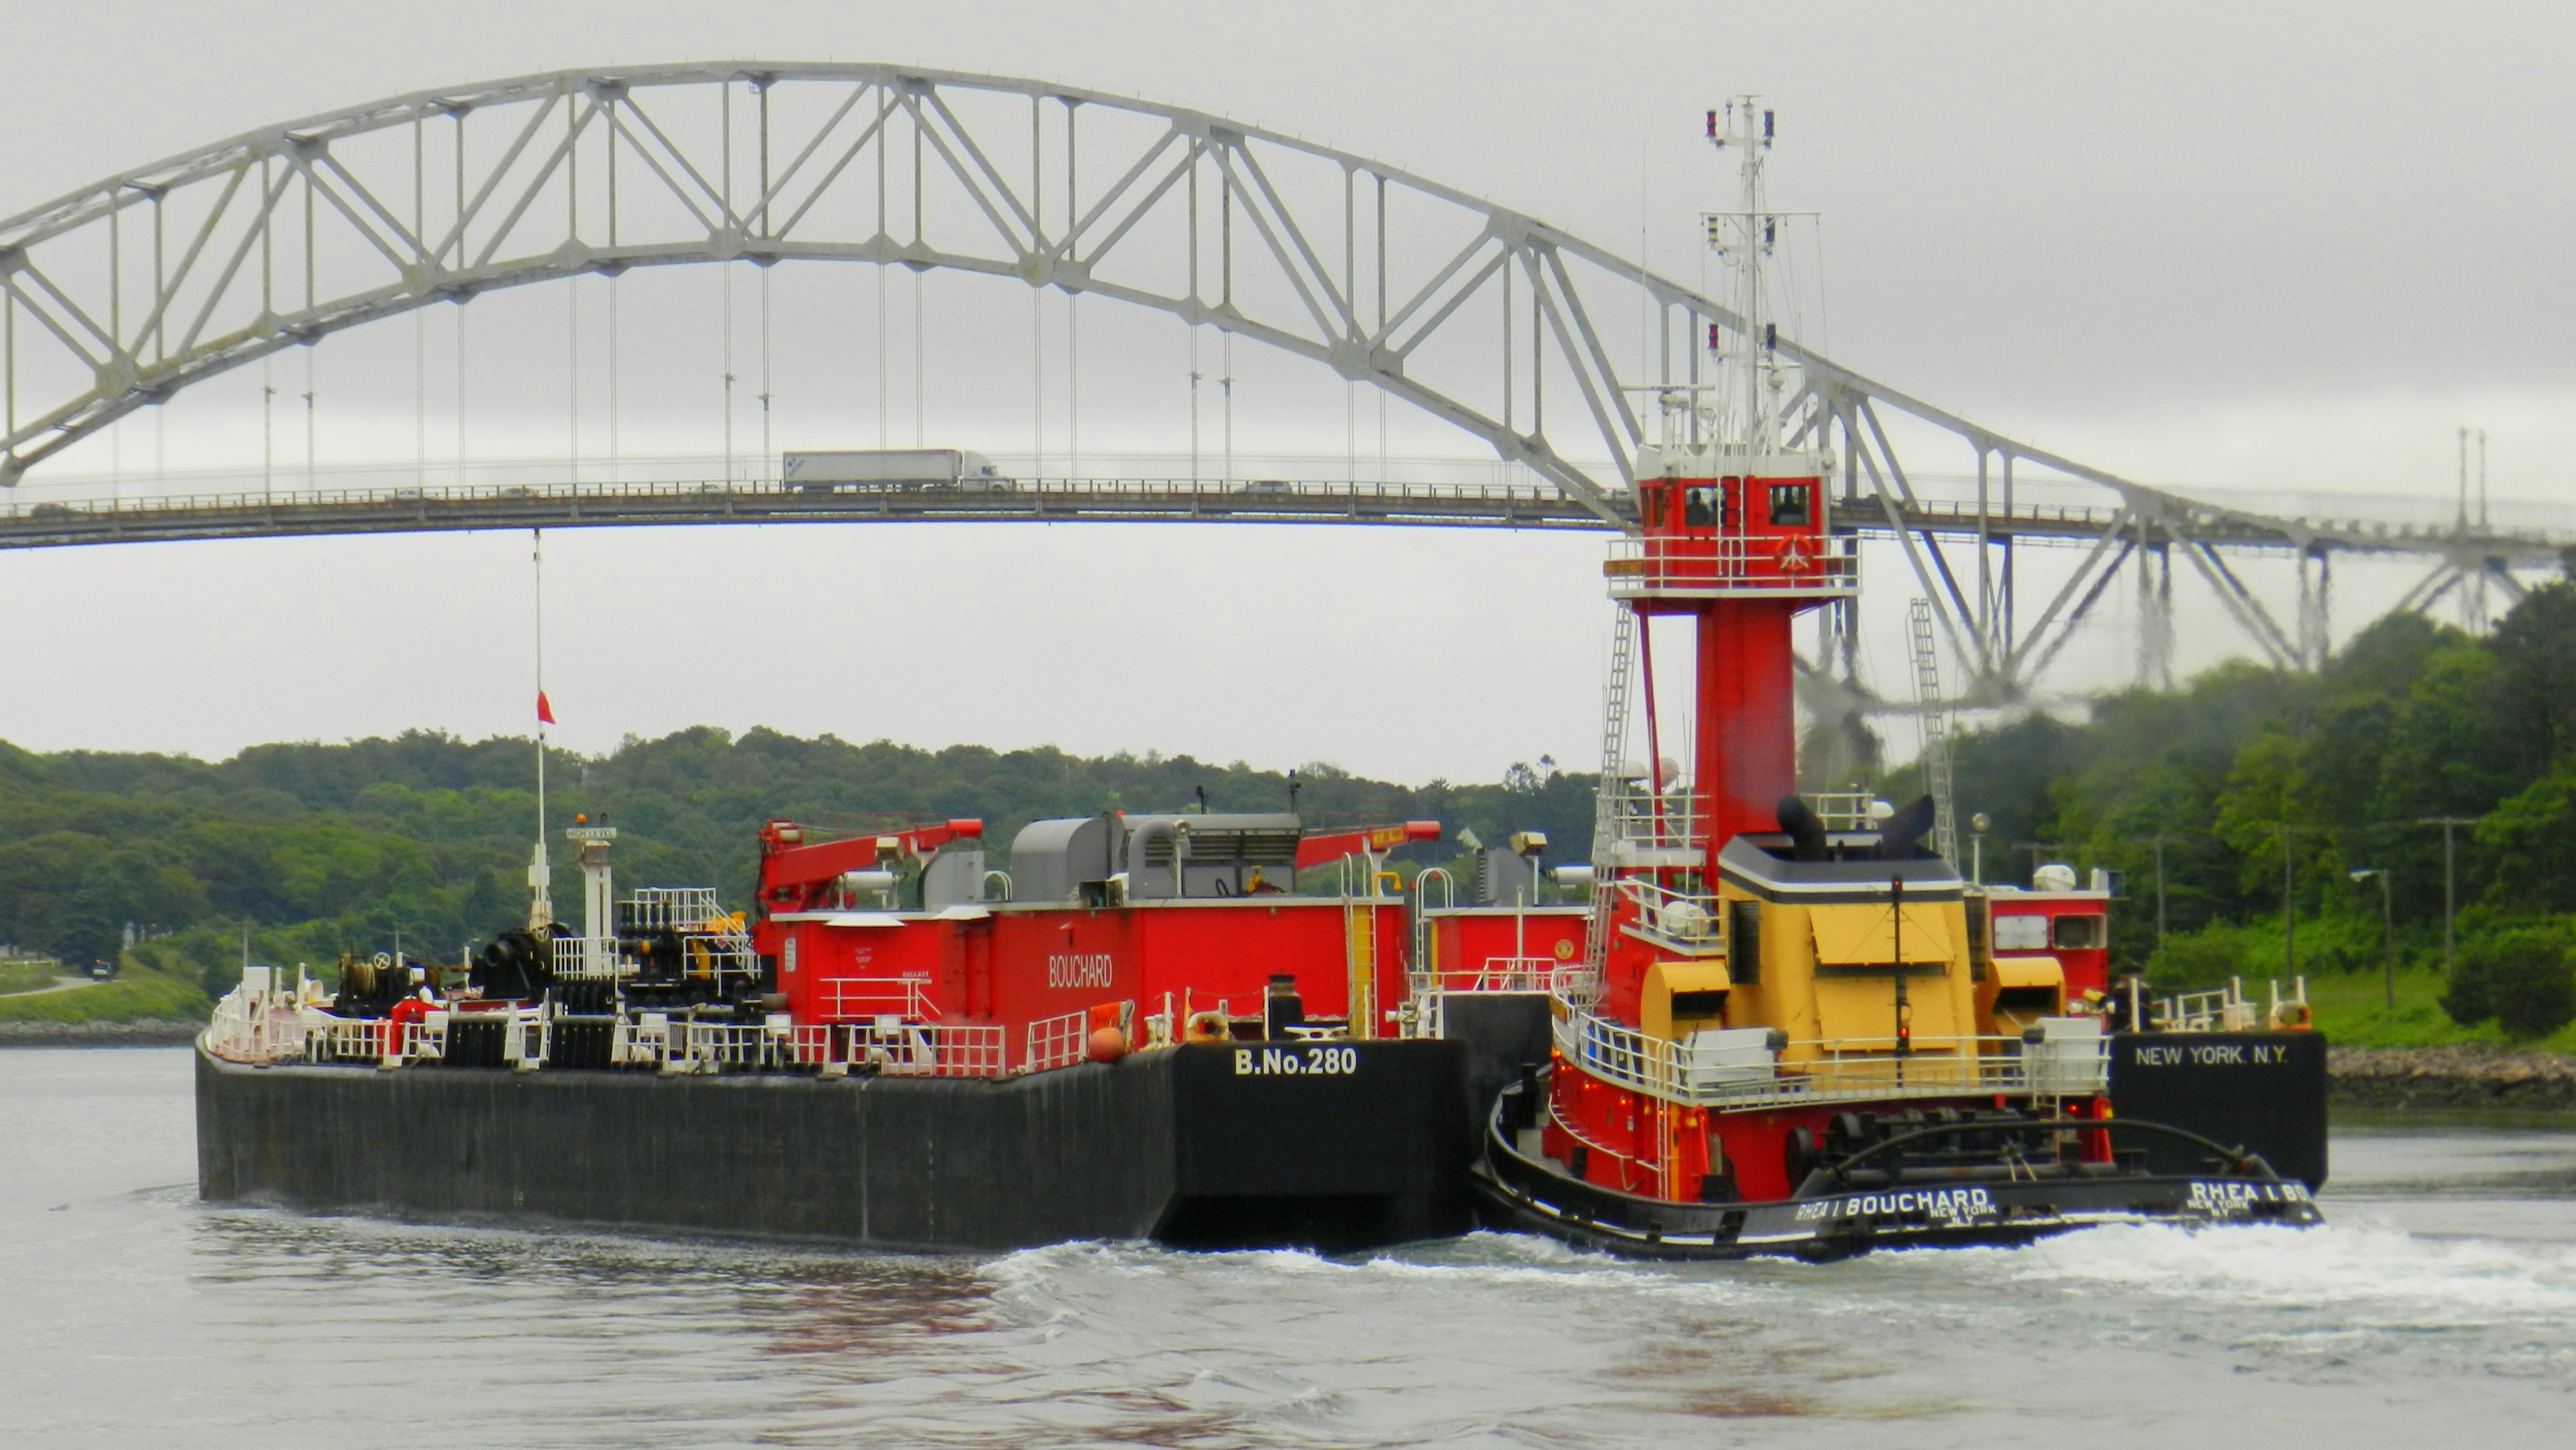
Barges have traditionally moved small amounts of crude oil from the Gulf Coast to Midwest refineries, and are also used to transport some refined products. Barge usage increased dramatically with the rapid development of the Bakken Shale (North Dakota and Montana) in the early 2010s, as crude oil could be shipped south by river to refineries in the lower Mississippi and Gulf Coast. In 2010, barges delivered 46 million barrels of crude oil to U.S. refineries. This rose to 244 million barrels in 2014, before decreasing with the downturn in the industry, with 165 million barrels delivered in 2016.12 Inland water transportation uses roughly 75% less energy than trucks and 25% less energy than rail, but is only viable where navigable rivers are close to both the source of oil and its destination.10
Oil barge at the Cape Cod Canal, 2011. Image credit: Pvalerio, Wikimedia Commons11
International Transportation
Crude oil, refined products, and natural gas move largely by pipeline between the U.S., Canada, and Mexico. In 2017, Mexico and Canada accounted for 44% of all U.S. petroleum imports13 and 30% of all U.S. petroleum exports.14
Canada – the U.S. largely imports Canadian crude oil and exports refined products. Pipelines crossing the U.S.-Canada border include 31 oil and 39 natural gas pipelines, plus 16 pipelines moving other commodities such as carbon dioxide and industrial chemicals.15 In 2016, 91% of all oil imported into the U.S. from Canada was transported by pipeline, 3% by rail, and 5% by marine vessels.16
Mexico – the U.S. largely imports Mexican crude oil and exports refined products, both by ship and by rail. The U.S. exports natural gas to Mexico via pipeline. U.S. natural gas exports to Mexico have grown from 333 billion cubic feet in 2010 to 1.37 trillion in 2016, and are projected to increase to 2.17 trillion cubic feet in 2020 as planned pipelines come online.17
Other countries – the U.S. exports and imports crude oil and refined products to and from other countries by sea. Total imports from countries other than Canada and Mexico were over 5 million barrels per day in 2017.18 Historically, the U.S. has exported very little crude oil and a larger amount of refined products. However, exports of both have risen rapidly in recent years, and in 2017 total exports of crude oil and refined products to countries other than Canada and Mexico exceeded 4.4 million barrels per day.19 Globally, marine vessels move huge volumes of crude oil, refined products, natural gas liquids, and natural gas around the globe. In 2016, oil, refined products, and natural gas represented roughly 30% of all international seaborne trade.20
In 2017, the U.S. exported over 650 billion cubic feet of natural gas as liquefied natural gas (LNG).21 This represents a huge increase from about 50 billion cubic feet exported annually from 1985 through 2011, and is almost four times the amount of LNG exported in 2016. This increase was driven by increased domestic gas production, increased liquefaction capacity, and low-cost export facilities converted from import terminals that had been constructed to import LNG before the domestic gas boom began in 2006. Almost all the LNG is exported from the Gulf Coast, but as of early 2018, export terminals are being built at existing import terminals in Georgia and Maryland.22 As of early 2018, almost half of all U.S. LNG exports were delivered to Mexico, South Korea, or China.23 Natural gas produced in Cook Inlet, Alaska, was exported to Japan from Alaska’s Kenai terminal in 2015 but not in 2016 or 2017,24 pending decisions over the future of the terminal.
Storage
Storage facilities are used to ensure a steady supply of important fuels, reducing the risks of supply disruption due to natural disasters, conflicts, and other major events.
Natural gas and crude oil. The natural gas industry uses nearly 400 underground storage facilities to ensure that supply remains steady during periods of high demand.25 The federal government’s Strategic Petroleum Reserve can store over 700 million barrels of crude oil in underground salt caverns near refineries along the Gulf Coast (enough oil to supply the entire United States for roughly five weeks).26 This reserve is part of a global storage system to respond to major supply disruptions, and was recently tapped in late August 2017 in response to supply disruptions from Hurricane Harvey.
Refined petroleum products. The northeast U.S. is home to two federal oil reserves for use in the event of a brief supply disruption. One holds a million barrels of home heating oil (created in 2000 and first used to reduce supply disruptions from Hurricane Sandy);27 the other holds a million barrels of gasoline (created in 2014 in response to Hurricane Sandy).28 Each reserve is spread over three locations in the Northeast. In total, these reserves contain roughly half a day’s supply of gasoline and a day’s supply of heating oil29 (based on winter usage) for the entire northeast. However, supply disruptions rarely affect the entire northeast U.S., so shipments can be made from these reserves to targeted areas for a longer period of time.
The damaged portion of Enbridge Line 6B is prepared for removal, having spilled hundreds of thousands of gallons of heavy crude oil near Marshall, Michigan, in July, 2010. Image credit: U.S. Environmental Protection Agency.32
Spills
A tiny proportion of all the oil transported in the U.S. is leaked or spilled; most of the transportation system is safe and effective. However, because the quantities of liquids being transported are so enormous, even a tiny portion of this can be large enough to have significant environmental impacts in the area of the spill.
2017 spill volumes by mode of transportation:30,31
- Rail – 56,000 gallons of crude oil and refined products from seven reported incidents
- Highway – 180,000 gallons of crude oil and refined products from approximately 100 reported incidents
- Pipelines – 2.58 million gallons of crude oil and refined products from 328 reported incidents
For each method of transport, spill volumes represent less than 0.001% of the total amount transported. The larger total amounts spilled from pipelines are mostly because almost all of the oil and refined products in the U.S. are transported by pipeline over long distances. Pipelines are less likely to spill than trucks (they don’t get into crashes), but when they do spill, the spills can be larger and more difficult to clean up, especially because most pipelines are buried underground and carry large volumes of oil and refined products.
Although oil and refined product pipeline operators employ leak detection systems, such as pressure or flow monitoring and/or internal surveys of pipe integrity, roughly half of all leaks are found by the public or local operating personnel.38
For more information on natural gas leaks, see “Methane Emissions in the Oil and Gas Industry” and “Mitigating and Regulating Methane Emissions” in this series; for more information on spills, see “Spills in Oil and Natural Gas Fields”.
Regulation of Transportation, Storage, Refining, and Marketing
The Pipeline and Hazardous Materials Safety Administration (PHMSA) in the U.S. Department of Transportation regulates the pipeline transport system and shipments of hazardous materials by land, sea, and air.39 The Federal Energy Regulatory Commission (FERC) regulates the practices and rates of interstate oil pipelines,40 while PHMSA regulates their operation. FERC also reviews applications for construction and operation of natural gas pipelines and LNG export and import terminals to certify their compliance with safety and environmental laws.
References
1 U.S. Pipeline and Hazardous Materials Safety Administration – National Pipeline Mapping System.
2 U.S. Pipeline and Hazardous Materials Administration – Annual Report Mileage Summary Statistics.
3 American Petroleum Institute and Association of Oil Pipe Lines (2016). Pipeline Performance Report & Strategic Plan.
4 U.S. Energy Information Administration – Petroleum and Other Liquids: Product Supplied.
5 U.S. Energy Information Administration – Movements of Crude Oil and Selected Products by Rail.
6 U.S. Energy Information Administration – Crude-by-rail volumes to the East Coast are declining. Today in Energy, August 3, 2016.
7 Canada National Energy Board – Canadian Crude Oil Exports by Rail – Monthly Data.
8 National Tank Truck Carriers (2015). Tank Truck Industry Market Analysis.
9 The Brattle Group (2014). Understanding Crude Oil and Product Markets. Prepared for the American Petroleum Institute.
10 Texas A&M Transportation Institute, Center for Ports and Waterways (2017). A Modal Comparison of Domestic Freight Transportation Effects on the General Public, 2001 – 2014. Prepared for the National Waterways Foundation.
11 File:Oil Barge at the Cape Cod Canal.jpg. Wikimedia Commons user Pvalerio. Reproduced according to a CC BY 3.0 license.
12 U.S. Energy Information Administration – U.S. Domestic Crude Oil Refinery Receipts by Barge.
13 U.S. Energy Information Administration – Monthly Energy Review: Petroleum, March 2018.
14 U.S. Energy Information Administration – Exports by Destination: Total Crude Oil and Products.
15 Natural Resources Canada – Frequently Asked Questions (FAQs) Concerning Federally-Regulated Petroleum Pipelines in Canada.
16 Canada National Energy Board – 2016 Oil Exports Statistics Summary.
17 U.S. Energy Information Administration (2018). 2018 Annual Energy Outlook: Natural Gas Imports and Exports.
18 U.S. Energy Information Administration – Petroleum and Other Liquids: U.S. Imports by Country of Origin.
19 U.S. Energy Information Administration – Petroleum and Other Liquids: Exports by Destination.
20 United Nations Conference on Trade and Development (2017). Review of Maritime Transport 2017.
21 U.S. Energy Information Administration (2018). Natural gas prices, production, and exports increased from 2016-2017. Today in Energy, January 16, 2018.
22 U.S. Federal Energy Regulatory Commission – North American LNG Import/Export Terminals Approved (As of January 24, 2018).
23 U.S. Department of Energy (2018). LNG Monthly, January 2018.
24 U.S. Energy Information Administration – U.S. Natural Gas Exports and Re-Exports by Point of Exit.
25 U.S. Energy Information Administration – The Basics of Underground Natural Gas Storage.
26 U.S. Department of Energy – Strategic Petroleum Reserve.
27 U.S. Department of Energy – Northeast Home Heating Oil Reserve.
28 U.S. Department of Energy – Northeast Gasoline Supply Reserve.
29 U.S. Energy Information Administration – Energy Explained: Use of Heating Oil.
30 U.S. Pipeline and Hazardous Materials Safety Administration – Office of Hazardous Materials Safety: Incident Reports Database Search.
31 U.S. Pipeline and Hazardous Materials Safety Administration – Pipeline Incident 20 Year Trends: All Reported Incident 20 Year Trend.
32 U.S. Environmental Protection Agency – Extracting the Damaged Pipeline. Accessed on Flickr.
33 Carter, J.M. et al. (2016). Estimating National Water Use Associated with Unconventional Oil and Gas Development. U.S. Geological Survey, Fact Sheet 2016-3032, May 2016.
34 Maupin, M.A. et al. (2014). Estimated Water Use in the United States in 2010. U.S. Geological Survey, Circular 1405.
35 U.S. Environmental Protection Agency – Water & Energy Efficiency by Sectors: Oil Refineries.
36 Veil, J. (2015). U.S. Produced Water Volumes and Management Practices in 2012.
37 "Management of Oil Field Wastes." P. Wright, Oil & Gas Law Report, March 29, 2013.
38 U.S. Pipeline and Hazardous Materials Safety Administration (2012). Leak Detection Study, DTPH56-11-D-000001.
39 U.S. Pipeline and Hazardous Materials Safety Administration – PHMSA Pipeline Technical Resources.
40 Federal Energy Regulatory Commission – What FERC Does.
Petroleum and the Environment
Download a full PDF of Petroleum and the Environment (free) or purchase a printed version ($19.99).
Other parts in this series:
1. Petroleum and the Environment: an Introduction
2. Water in the Oil and Gas Industry
3. Induced Seismicity from Oil and Gas Operations
4. Water Sources for Hydraulic Fracturing
5. Using Produced Water
6. Groundwater Protection in Oil and Gas Production
7. Abandoned Wells
8. What Determines the Location of a Well?
9. Land Use in the Oil and Gas Industry
10. The Pinedale Gas Field, Wyoming
11. Heavy Oil
12. Oil and Gas in the U.S. Arctic
13. Offshore Oil and Gas
14. Spills in Oil and Natural Gas Fields
15. Transportation of Oil, Gas, and Refined Products
16. Oil Refining and Gas Processing
17. Non-Fuel Products of Oil and Gas
18. Air Quality Impacts of Oil and Gas
19. Methane Emissions in the Oil and Gas Industry
20. Mitigating and Regulating Methane Emissions
21. Regulation of Oil and Gas Operations
22. Health and Safety in Oil and Gas Extraction
23. Subsurface Data in the Oil and Gas Industry
24. Geoscientists in Petroleum and the Environment
Glossary of Terms
References
Transporting Water
Water used for drilling, oil and gas production, and hydraulic fracturing (not fully quantified33 but probably in the range of a few billion gallons per day34), and for refining oil (1-2 billion gallons per day)35 must also be transported from its source to where it is needed. In addition, “produced water” extracted along with oil or gas (roughly 2.5 billion gallons per day)36 must be transported to a disposal or reuse site. In established oil-producing areas or at permanent facilities, water may be moved by pipelines, but it is otherwise moved largely by truck. Oilfield waters are generally not federally regulated as hazardous wastes and so are not regularly measured and tracked. However, state or federal regulations may require certain management or handling practices for oilfield waters.37


