Emissions from production, processing, refining, and use
Introduction
All widely used combustible fuels emit harmful (toxic or ozone-forming) gases and particles when burned to provide energy. These air pollutants can have a wide array of public health impacts, such as increasing the rate of certain cardiovascular (heart) and pulmonary (lung) diseases, cancers, and strokes.1 Mobile emission sources, including cars, trucks, trains, and airplanes using gasoline, diesel, and aviation fuel account for more than half of all air pollutant emissions in the United States.2 Stationary sources such as oil- and gas-fields, oil refineries, and gas processing plants are small in comparison to those from burning fuels but may have significant local impacts.
Oil and gas production, processing, and use also release large quantities of greenhouse gases, especially methane and carbon dioxide. Although these gases have climatic impacts and are regulated by the U.S. Environmental Protection Agency (EPA), they do not significantly impact local air quality except at high concentrations in confined spaces, so they are not discussed in this sheet. For more information on methane and carbon dioxide emissions, see other sections in this series: “Petroleum and the Environment: an Introduction”, “Methane Emissions in the Oil and Gas Industry”, “Mitigating and Regulating Methane Emissions”, and “Oil Refining and Gas Processing”.
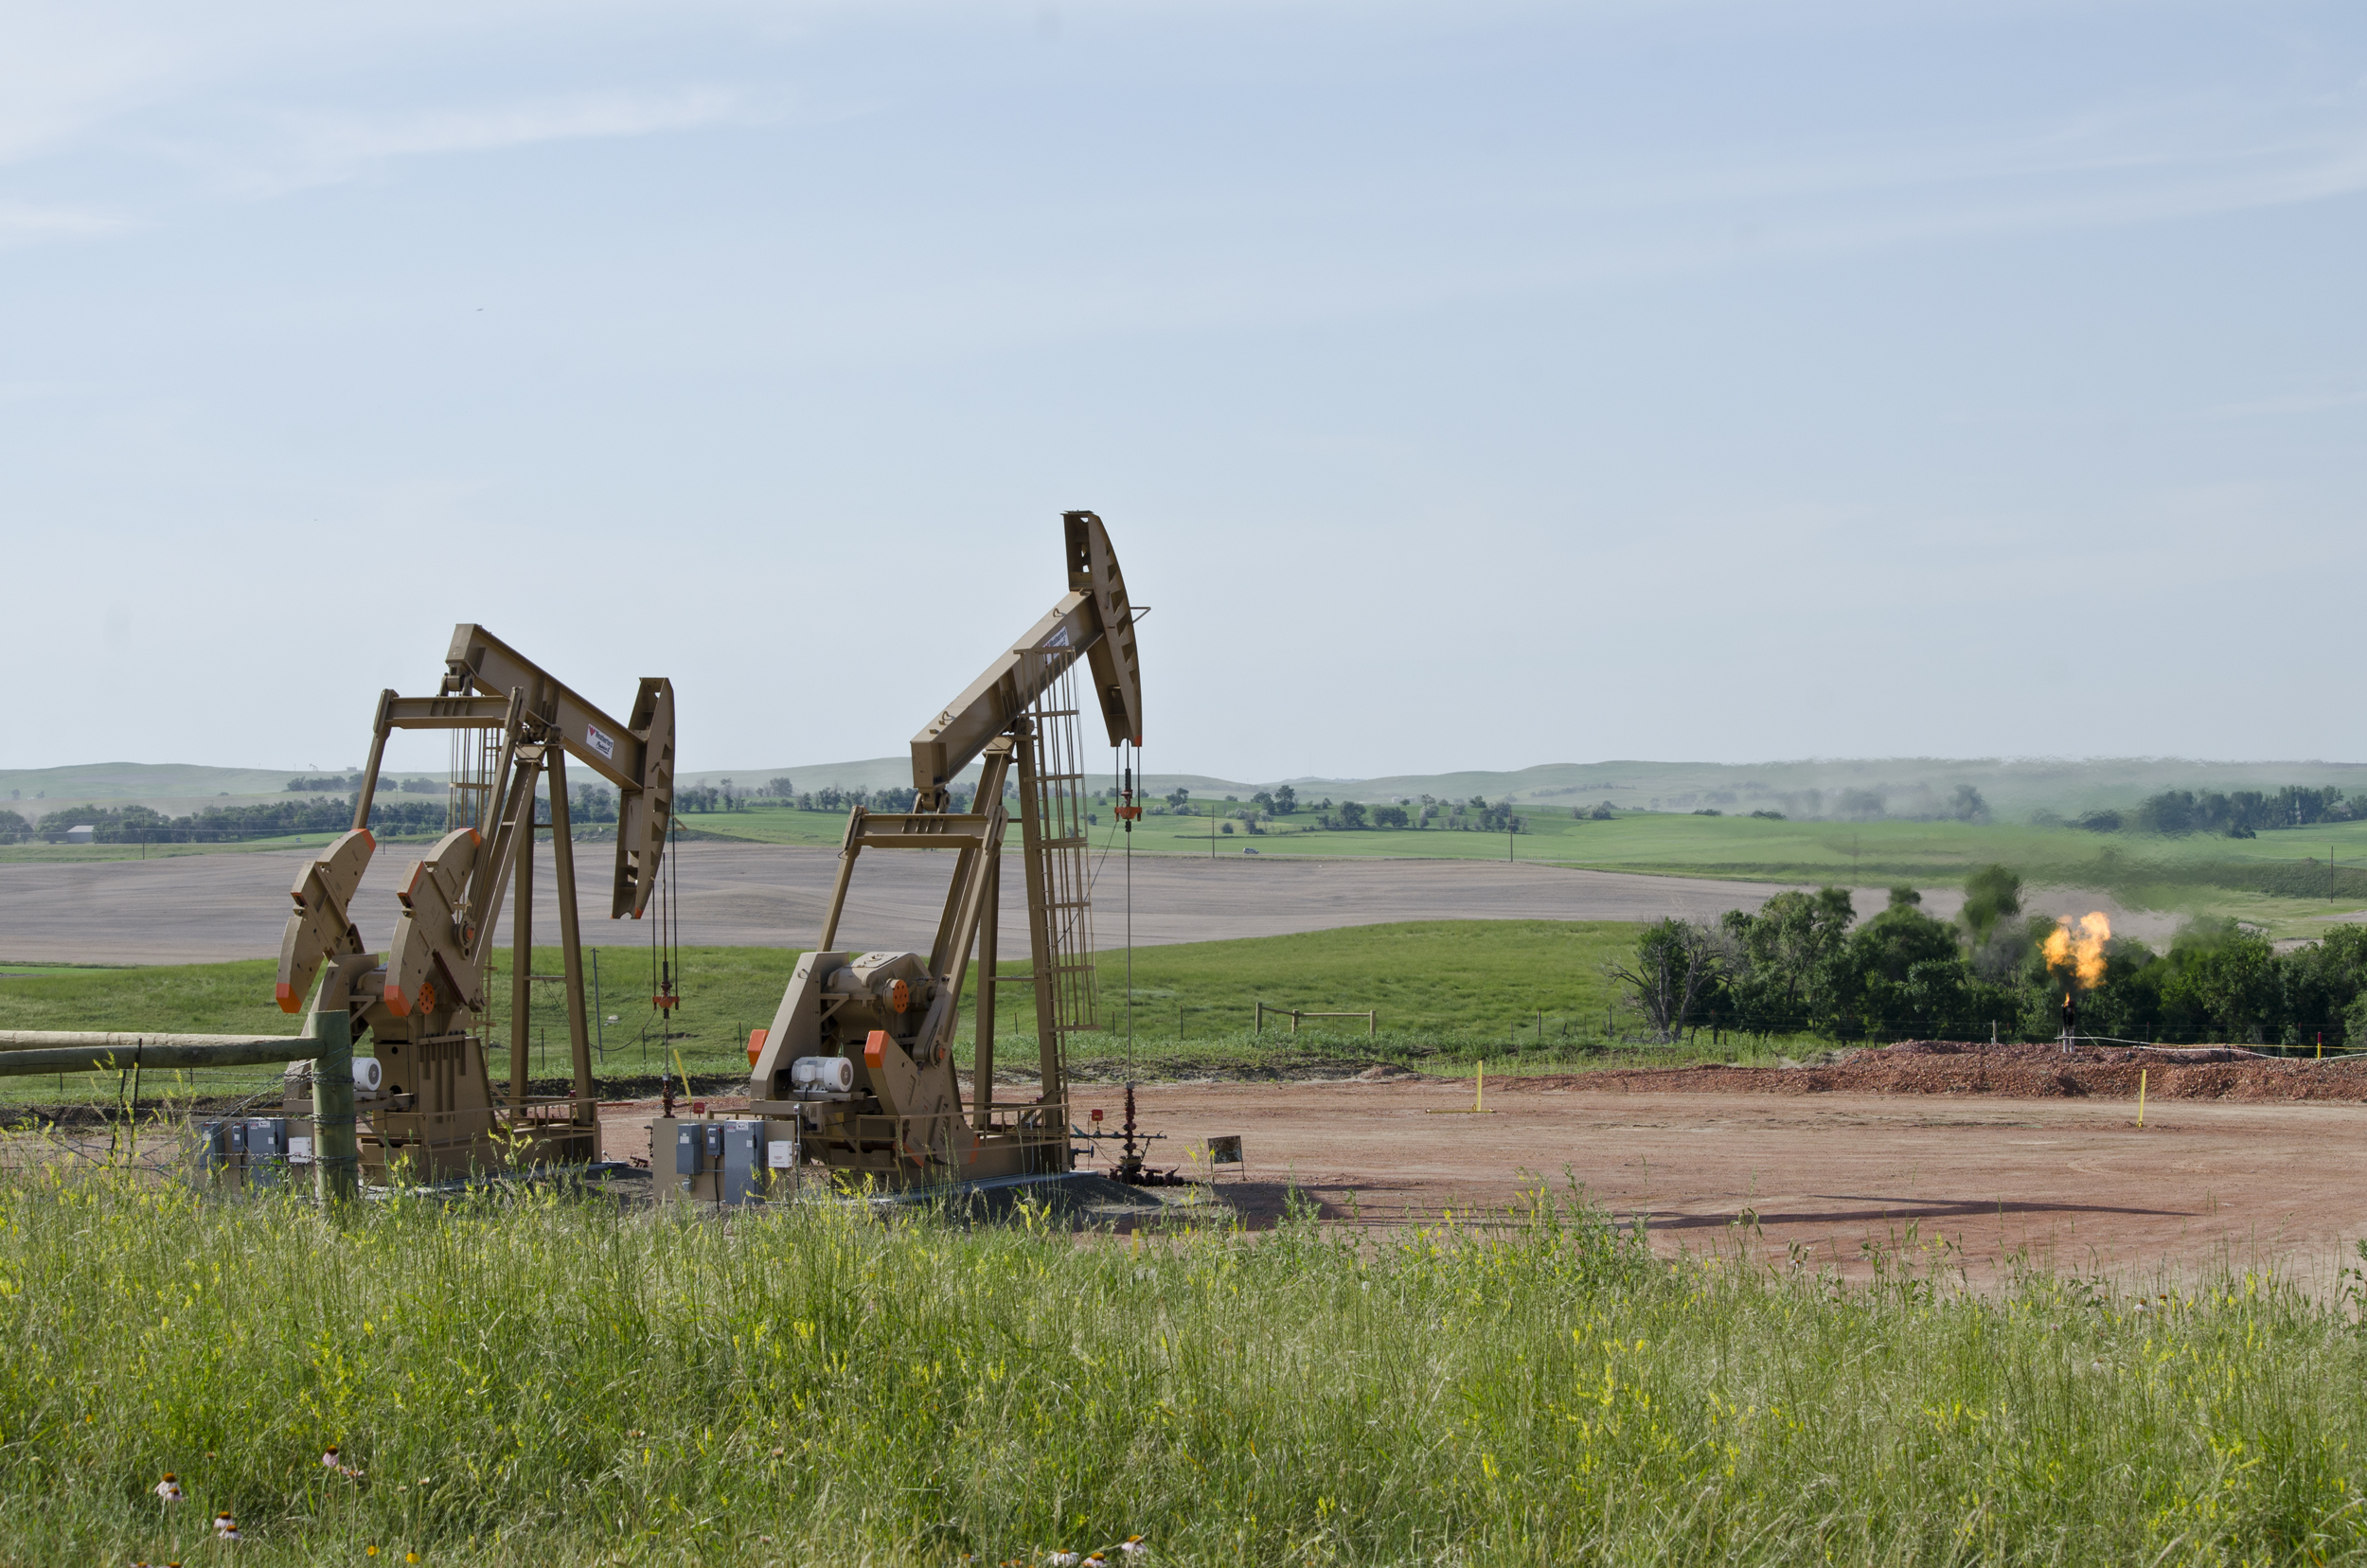
Flaring of unprocessed natural gas, as seen here on a well site in North Dakota (flare on right of picture), is one of several oilfield processes that can negatively affect air quality, as well as increasing carbon dioxide emissions. Flaring in North Dakota was particularly common in the early 2010s, as oil production was booming but pipelines were not in place to collect and transport the natural gas produced from oil wells. Image credit: Tim Evanson, Flickr.3
Major Air Pollutants and the Regulatory Framework
Six major pollutants produced directly or indirectly by burning fossil fuels (in addition to other human activities) are required by law to be regulated by the EPA under the Clean Air Act: carbon monoxide (CO), nitrogen oxides (NOx), sulfur oxides (SOx) ozone (O3), particulate matter (PM), and lead (Pb).4
The EPA and states also set standards for 187 other “air toxics” with serious known or suspected health effects.5 These include some oil and gas components, such as benzene, which is found in gasoline. Oil- and gas-related air toxics may be emitted during petroleum exploration, production, refining and processing, and combustion. The wide range of potential emission sources requires a variety of regulations to effectively manage different emissions at different points in the oil and gas supply chain.
The Environmental Protection Agency (EPA) takes two general approaches to regulating air pollution related to petroleum exploration and production activities:
- The EPA sets ambient air quality standards for the six major air pollutants mentioned above, and periodically revises these standards based on current scientific information about health impacts and the availability of pollution-reducing technology.6 States develop and enforce implementation plans to control air pollutants, and tailor these plans to their specific sources to comply with EPA air quality standards. Areas within a state that fail to meet air quality standards (“non-attainment areas”) face additional restrictions.7 State rules may regulate vehicle emissions and the construction and operation of industrial plants including petroleum refining, storage, transportation, and marketing facilities.
- The EPA also sets maximum legal pollutant emissions and provides guidelines on the appropriate type of pollution control for the six major pollutants and specific air toxics at certain stationary sources across industries.8 Those related to oil and gas include gas turbines, boilers, gasoline terminals, and petroleum refineries.
New emission regulations are often contentious. New regulations may require industries to install new equipment or adopt new procedures to ensure compliance, sometimes at significant cost; the health or safety benefits of a new regulation may be debated; and some may argue that a regulation does not do enough to meet environmental or public health needs. Regulators receive public input from a wide variety of stakeholders while developing new regulations. However, because stakeholders often have many competing priorities, the final regulations are often challenged in court as being either too mild or too onerous.
Ozone and Oil & Gas Production
Oil- and gas-producing areas may have high levels of volatile organic compounds (VOC) that contribute to harmful ozone formation in the lower atmosphere. VOCs are emitted by vehicles and equipment used in oil operations as well as in surrounding roads and communities. VOCs also evaporate directly from the oil and gas being extracted, stored, and transported around the oilfield.9 Storage tanks, certain types of pumps and compressors, and leaky valves and fittings may allow VOCs to escape into the atmosphere. High levels of VOCs have been measured in some oil- and gas-producing areas, such as the Eagle Ford in South Texas.10,11 However, quantifying these oilfield emissions and their effects on air quality is often complicated by variable and/or unknown background ozone levels; determining the contribution of oilfield emissions to ambient VOC levels is an active area of current research.
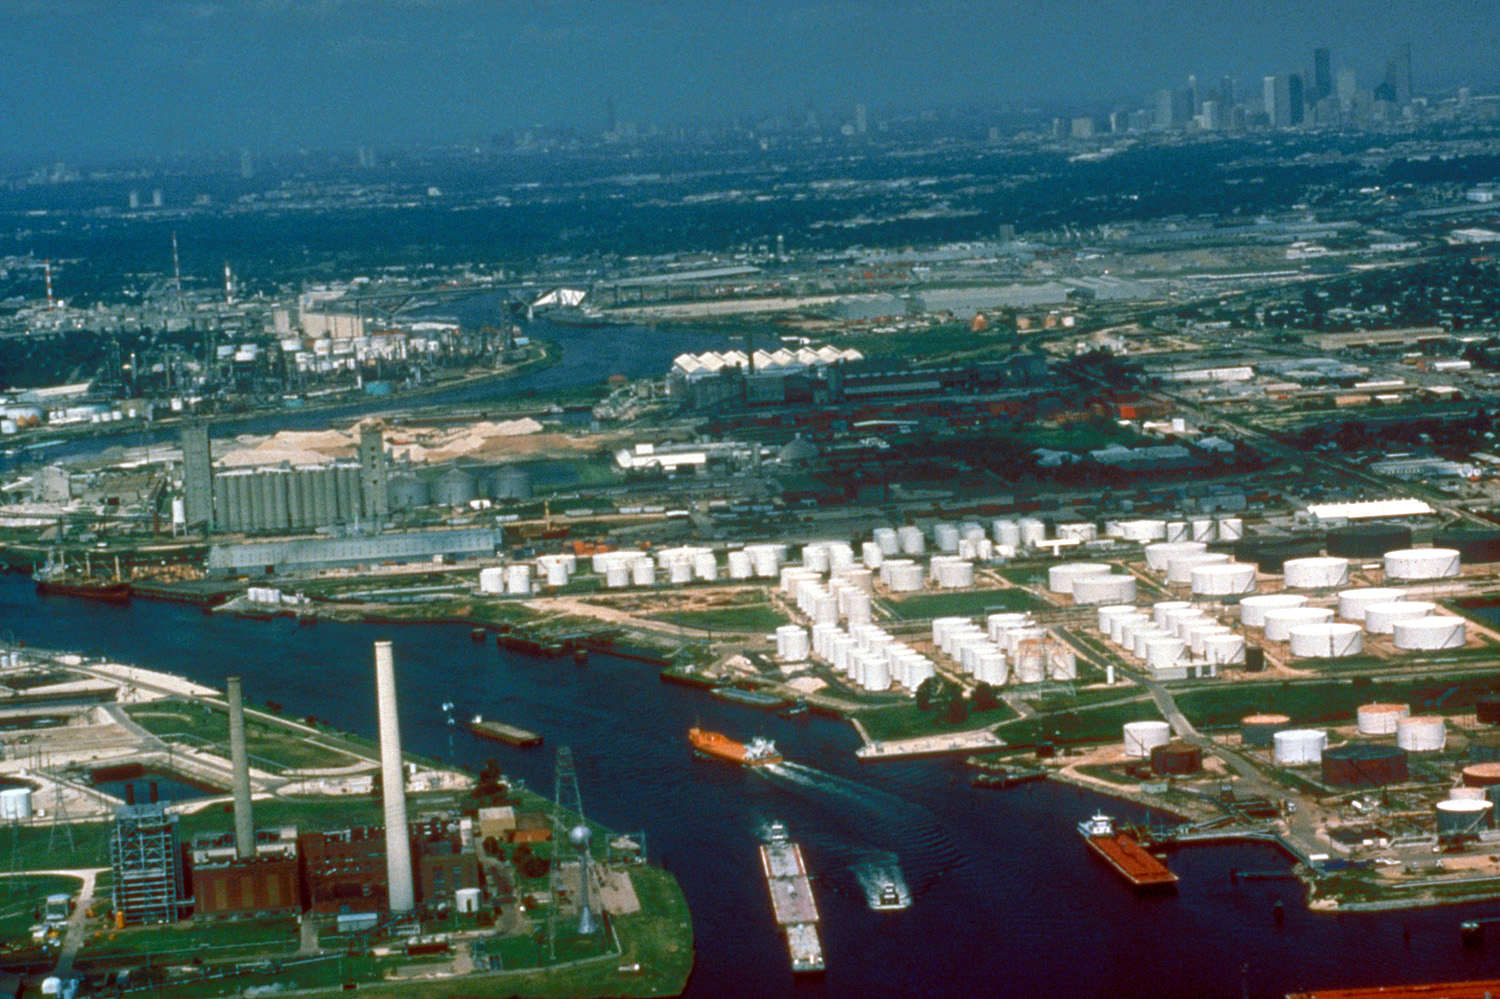
Refineries, fuel shipping terminals, and other industrial facilities along the Houston Ship Channel, 1999. The city of Galena Park is center-right. Roughly half of all U.S. refining capacity is located on the Texas and Louisiana coasts, leading to a higher risk of air pollution from refineries in this region of the Gulf Coast. Image credit: Army Corps of Engineers.23
Air Pollution from Oil Refineries and Gas Processing Plants
Oil refineries convert crude oil into a vast array of products, requiring a range of operations that emit a variety of pollutants, both through normal operations and in accidents. The EPA’s enforcement of the Clean Air Act at petroleum refineries has led to dozens of settlements in which companies have agreed to invest billions of dollars in control technologies and supplemental environmental projects.12 Due largely to this enforcement, from 2000 to 2011, combined SOx and NOx emissions from refineries decreased by 75%.13 Other regulations control VOC and benzene emissions from equipment at refineries and petroleum product distribution systems.14
Natural gas processing has fewer air pollution risks, but some plants that process natural gas containing hydrogen sulfide – a poisonous, corrosive, and flammable gas – are regulated as toxic release sites.15 The range of refinery and processing plant operations and their related emissions are summarized in the EPA’s Compilation of Air Pollutant Emission Factors.16
Refinery emissions can be reduced by many means, including improved furnace efficiency, leak detection and control, gas recycling, reduced flaring and venting, scrubbers, and catalytic reactors.17,18,19,20 From 1990 to 2013, refinery emissions of air toxics decreased by 66% and VOC emissions decreased by 69%, despite a 14% increase in the amount of crude oil being processed.21 For communities near refineries, such as Galena Park near Houston, Texas (see figure), sustained future decreases in emissions from refineries and fuel storage facilities are an important part of mitigating the local public health impacts of oil and gas activity.22
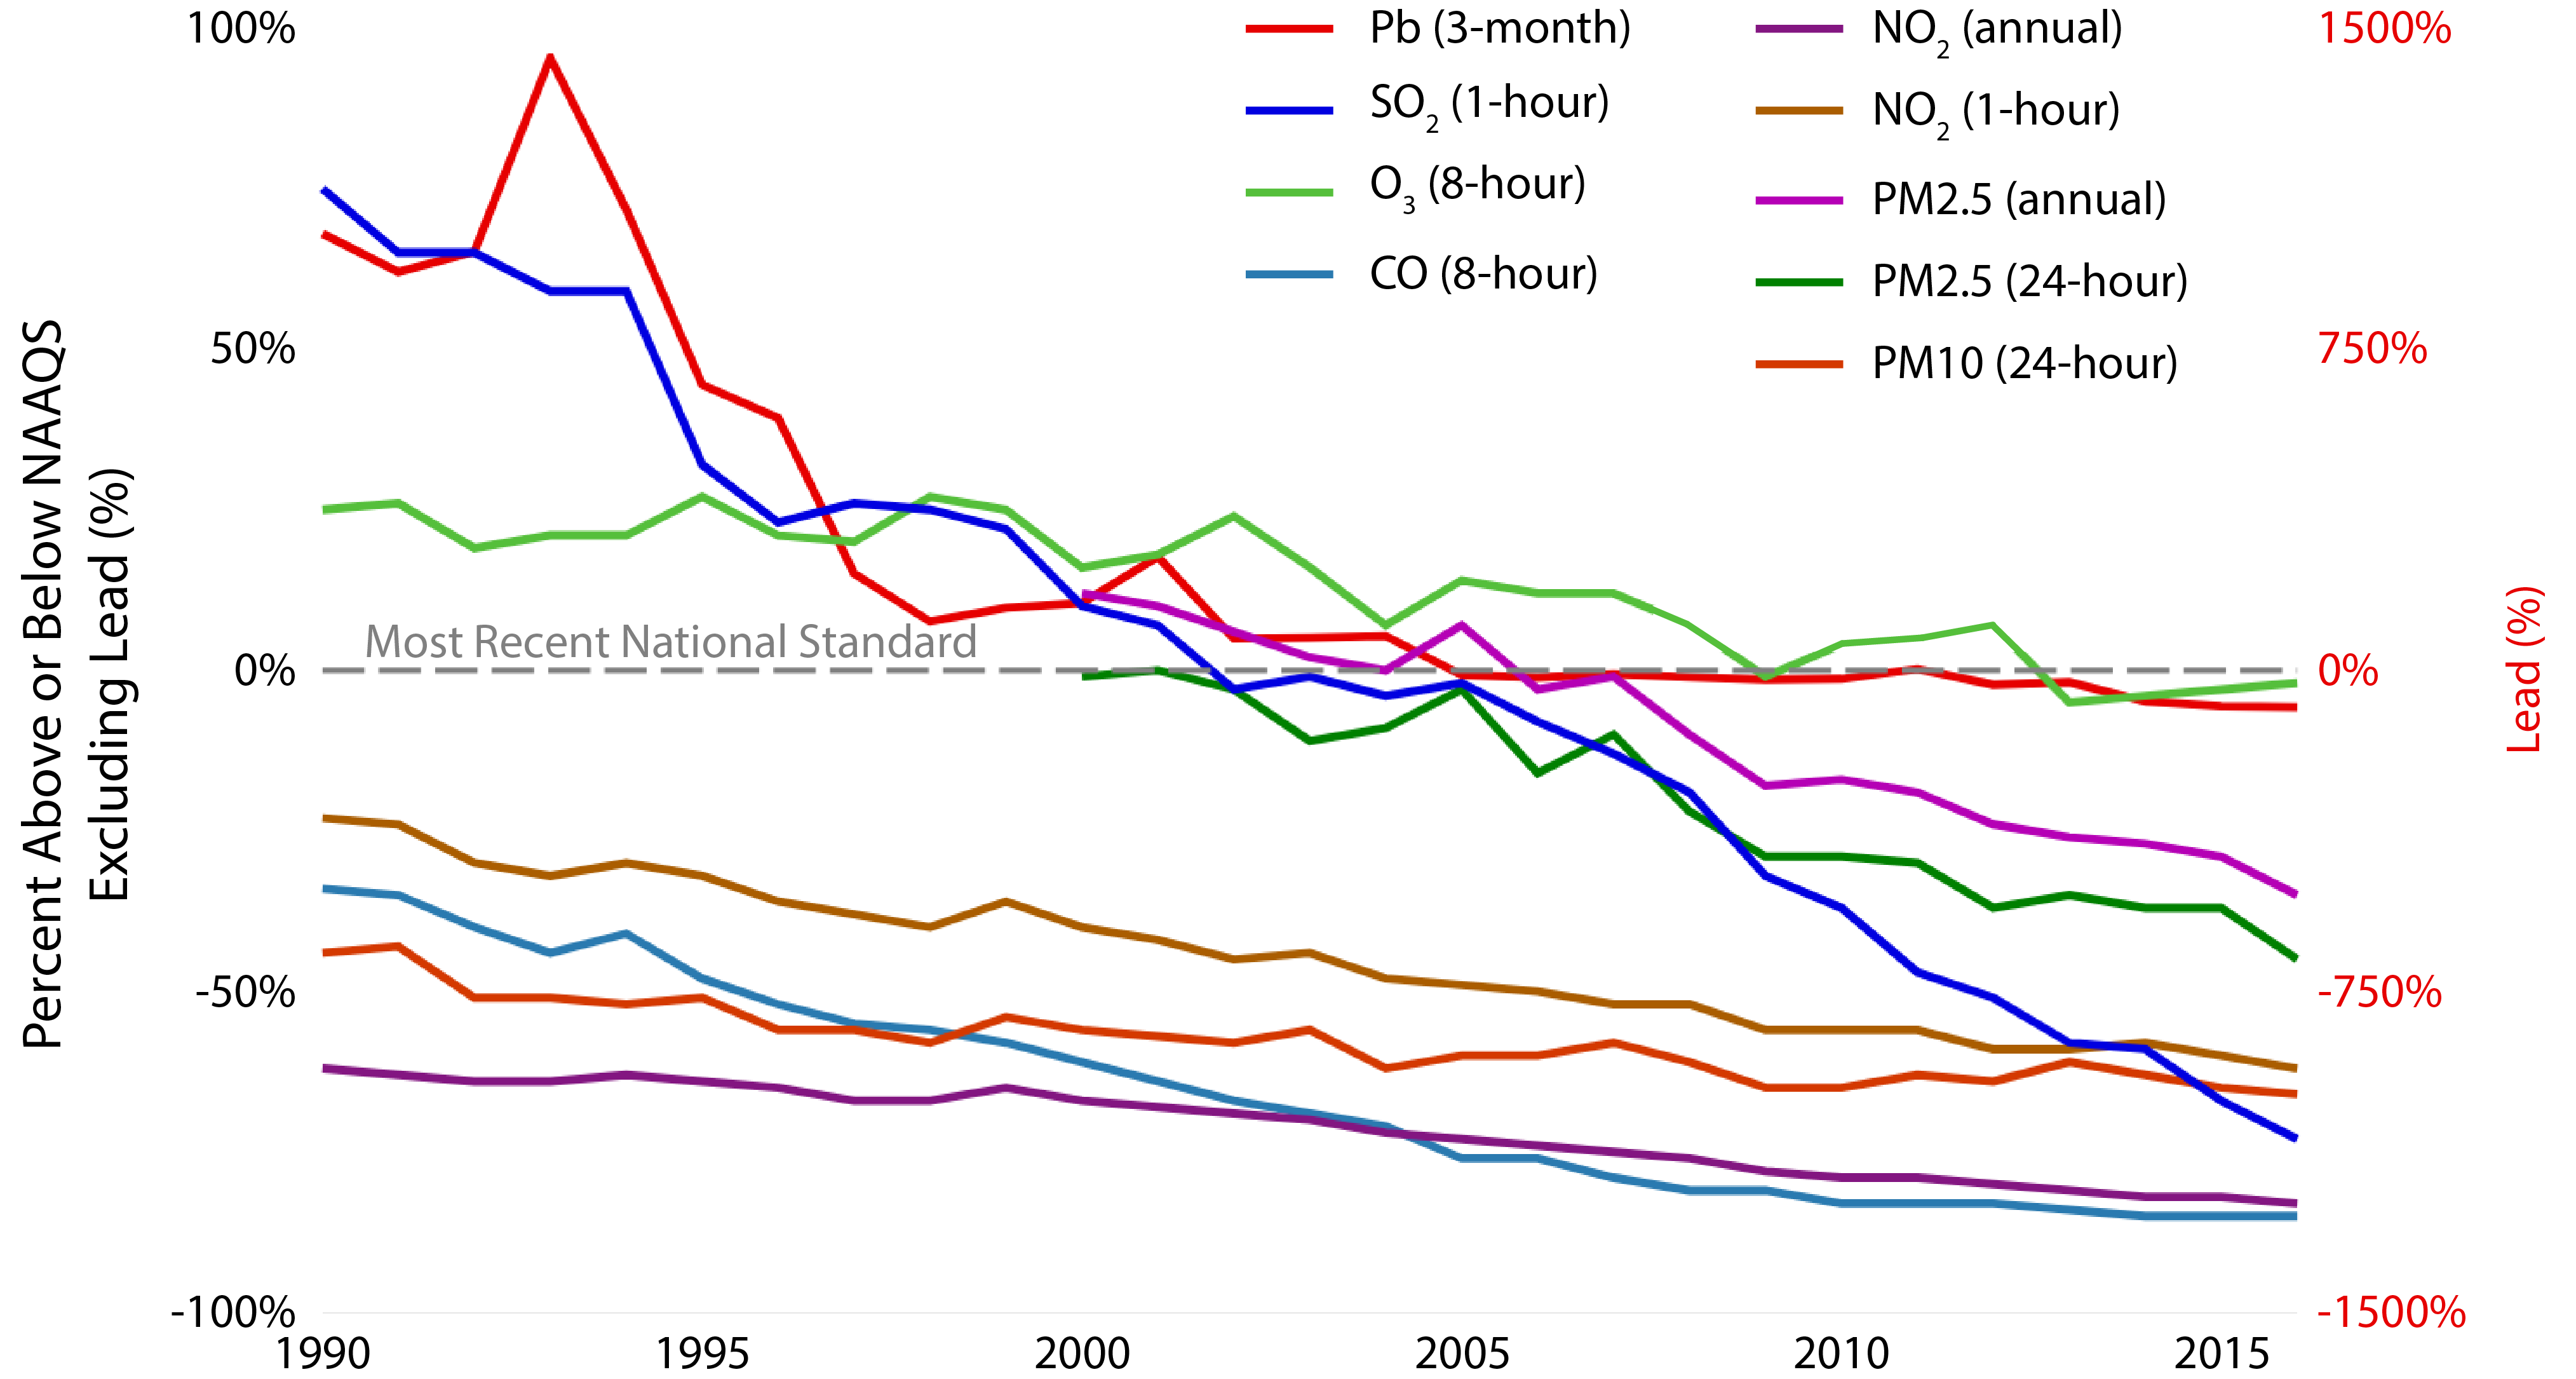
Changes in the average U.S. concentrations of the EPA’s six target air pollutants from 1990-2016. Time periods indicate duration over which measurements are averaged. NAAQS = National Ambient Air Quality Standards. Image credit: U.S. Environmental Protection Agency.31
Combustion and U.S. Air Quality Over Time
In the United States, attempts to decrease the emission of pollutants from fossil fuel combustion have been highly successful, especially since the Clean Air Act of 1970 (with revisions in 1977 and 1990).4 From 2000-2016, average air concentrations decreased for ozone (by 17%), particulate matter (42%), lead (93%), sulfur dioxide (72%), nitrogen dioxide (47%), and carbon monoxide (61%).24 Reflecting this improvement, the total number of days per year that 35 major metropolitan areas reported their air quality index as “unhealthy for sensitive populations” or worse decreased from 2,076 days in 2000 to 697 days in 2016, a reduction of 66%.25
These pollutants have been reduced in a number of different ways:
- Carbon monoxide and NOx emissions have been reduced by fitting engine exhausts with catalytic converters (to convert carbon monoxide to carbon dioxide) and NOx traps (to remove NOx).
- Lead was added to gasoline starting in the mid-1920s to improve engine operation, but it is a potent neurotoxin. Atmospheric lead levels in the U.S. began to decrease in the 1970s with EPA-mandated reductions in leaded gasoline and the introduction of catalytic converters to car exhausts, which require unleaded gasoline. Since 1996, lead has been completely banned from all gasoline for road vehicles in the United States,26 although as of 2018 some small aircraft are still permitted to use aviation gasoline containing lead.27 Since 1990, average atmospheric lead concentrations in the U.S. have decreased by 99%.28
- Sulfur oxides (SOx, mostly sulfur dioxide, SO2) are primarily produced by the burning of fossil fuels (especially coal) in power plants and other industrial facilities. Sulfur emission reductions started with ambient air quality standards set by the EPA in the 1970s,29 and continued with the 1990s Acid Rain Program, which set procedures for coal-fired power plants to reduce SOx and NOx emissions that contribute to acid rain.30 The switch from coal to natural gas power generation since the 1980s has further cut SOx emissions. Refineries and processing plants are also required to capture sulfur from oil and gas, reducing SOx emissions upon combustion.
Particulate matter and ozone (major ingredients of smog) are both produced by the reaction of other pollutants in the atmosphere. In addition, particulate matter is emitted directly in gasoline- and diesel-vehicle exhaust. In the U.S., the EPA has set ambient air quality standards for particulate matter and ozone since 1970, reviewing and tightening these standards on several occasions.32,33 Enforcement of EPA air quality standards decreased total emissions of particulate matter from vehicles by more than 50% from 2002 to 2016.34 Standards issued in 2007 and 2014 will continue to lower emissions as the vehicle fleet turns over to newer vehicles that conform to these standards.35 The story is similar for air toxics: from 1990 to 2014, average atmospheric concentrations of air toxics decreased by 68%,25 and from 1990 to 2009, benzene levels decreased by 66%.36
Despite these improvements, air pollution still presents a serious health risk in urban areas. The EPA estimates that 14 million people in roughly 60 urban areas of the U.S. have more than a 1-in-10,000 lifetime risk of developing cancer caused by air pollution – ten times higher than the overall U.S. population.38 Over time, the past success of regulations and technologies in improving U.S. air quality means that additional emissions reductions come at increasing cost relative to the size of the reduction.39 Evaluating the economic, environmental, and health impacts, the difficulty of measuring and understanding impacts on large and diverse human populations, and the huge variety of different stationary and mobile emission sources combine to make air quality management a perennially controversial subject.
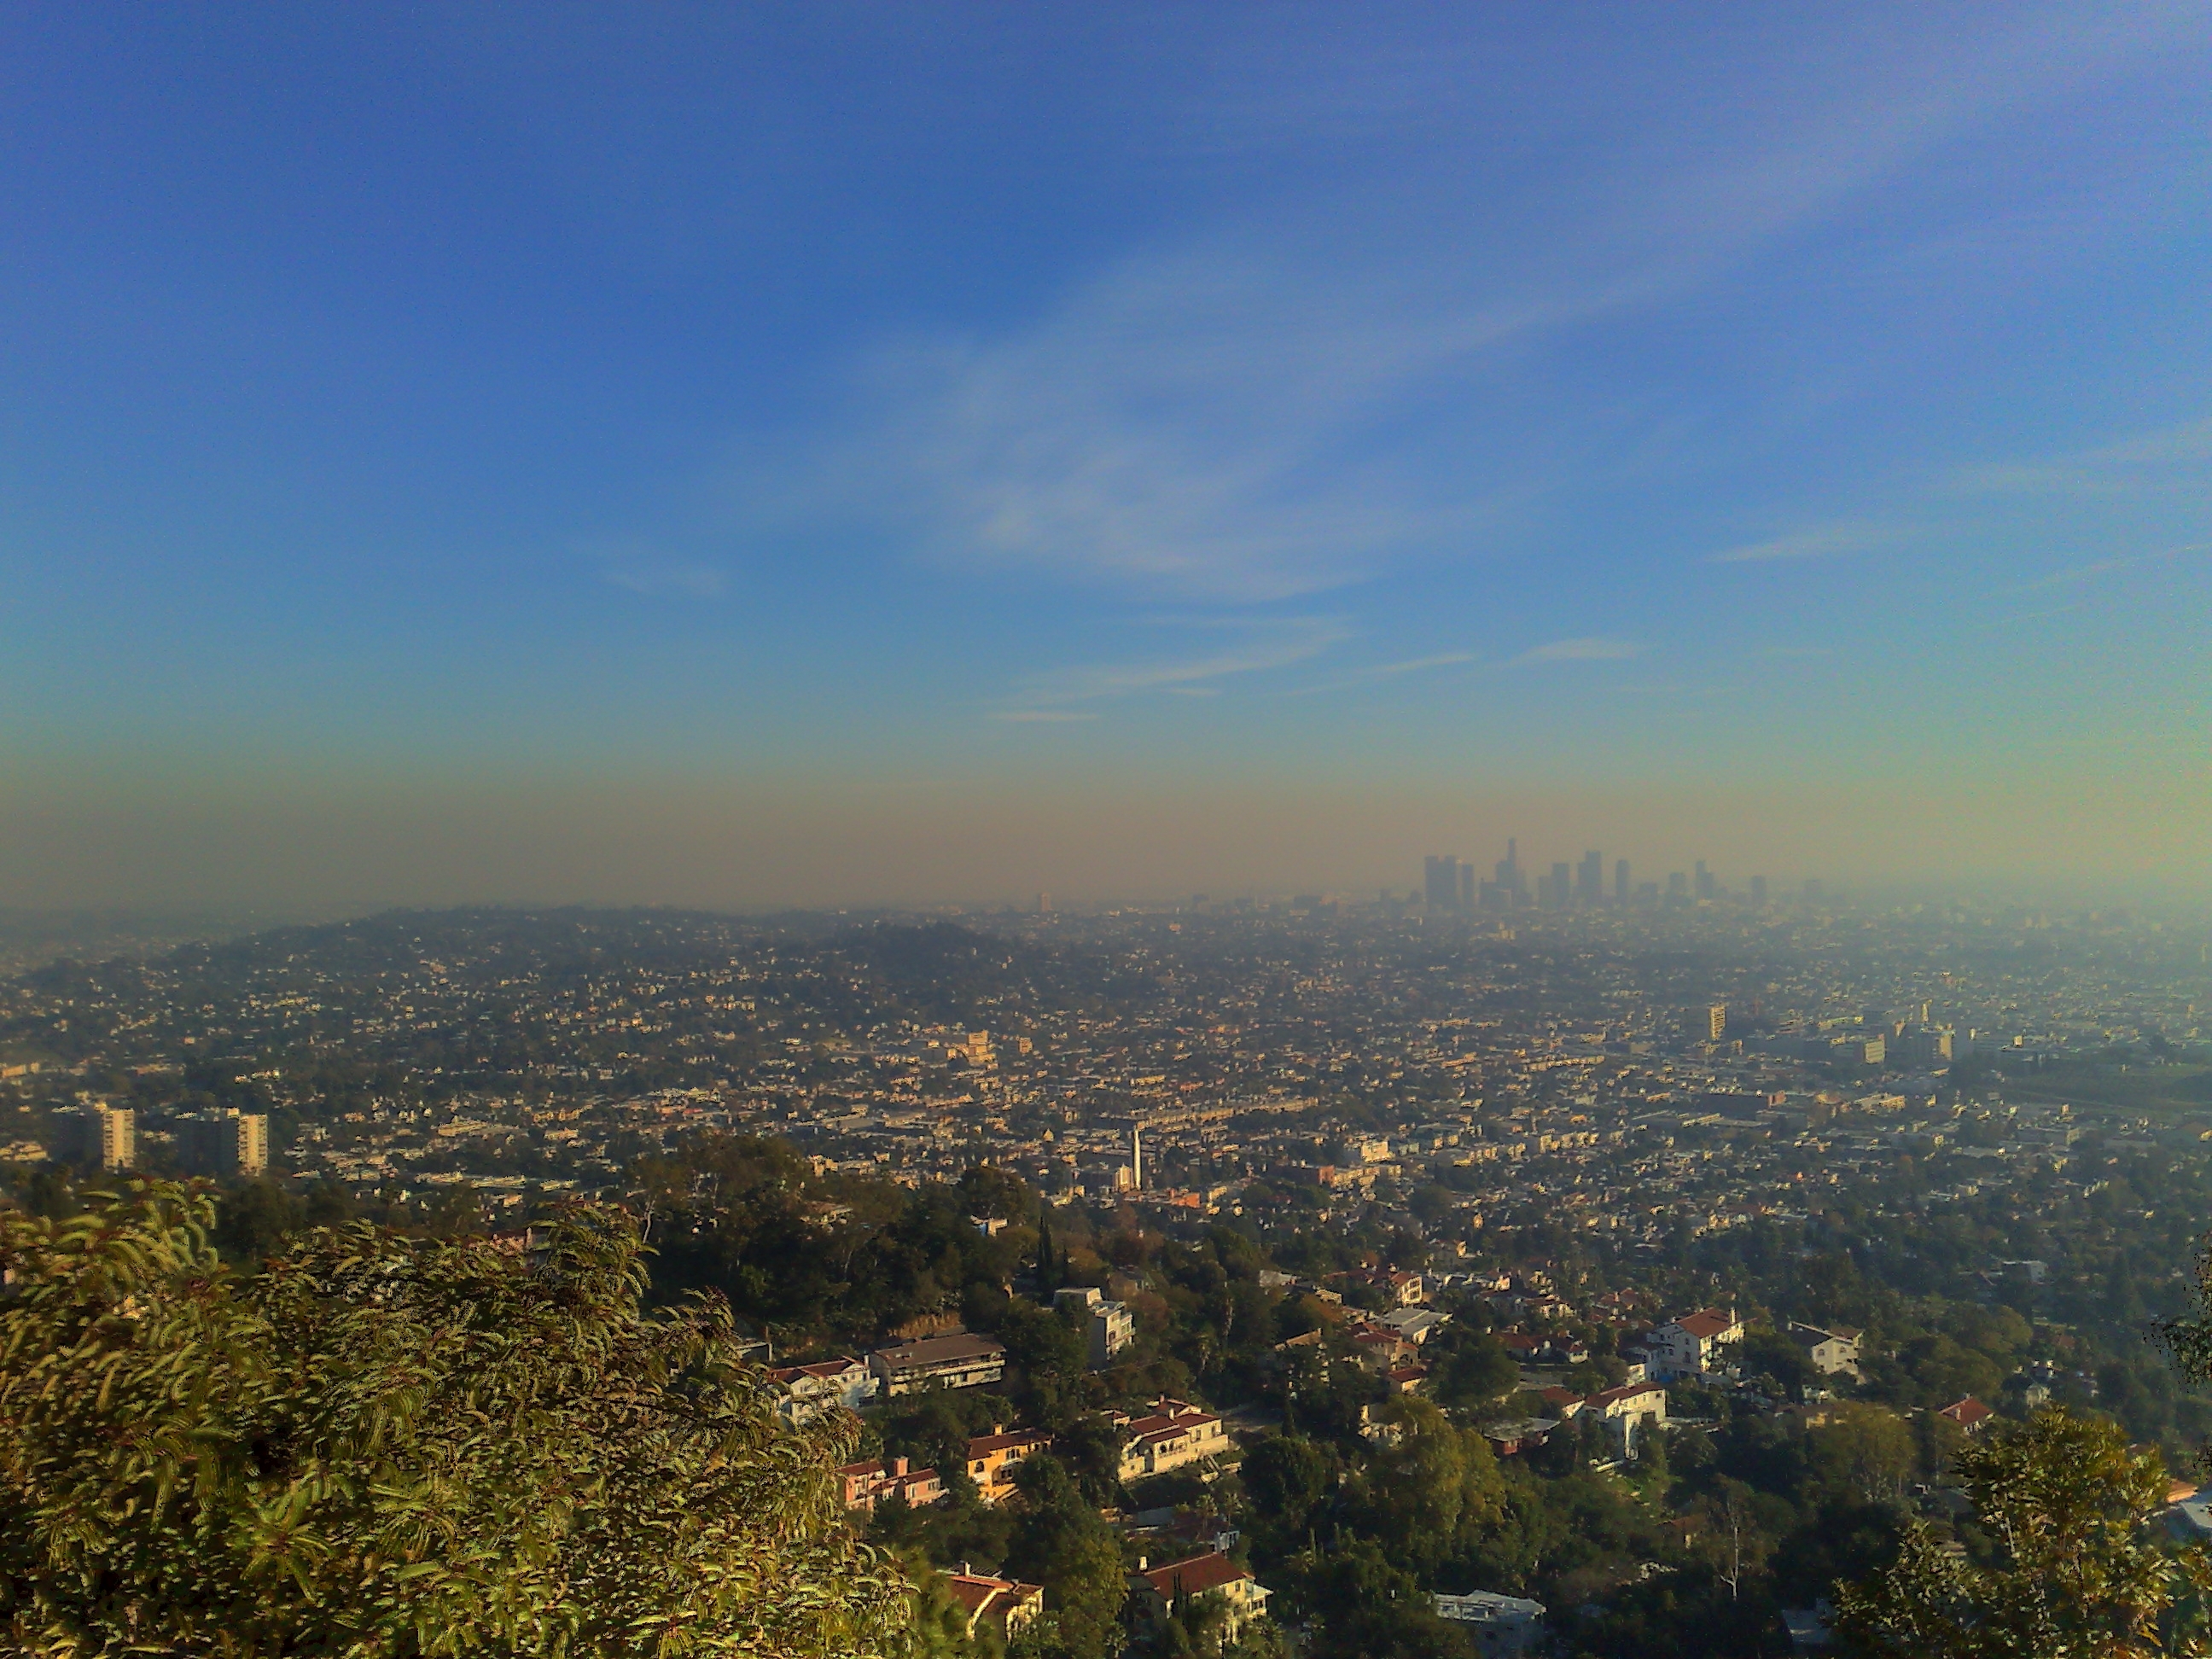
Smog visible as an orange haze over Los Angeles. Large urban areas in the United States still experience degraded air quality due in large part to the emission of smog-forming molecules and particulate matter from gasoline and diesel engines in vehicles. Image credit: Al Pavangkanan, Flickr.37
More Resources
World Health Organization – Ambient (outdoor) air quality and health.
U.S. Environmental Protection Agency – Air Emissions Sources.
National Institute of Environmental Health Sciences – Air Pollution.
U.S. Environmental Protection Agency – Air Quality – National Summary.
U.S. Environmental Protection Agency – Benefits and Costs of the Clean Air Act 1990-2020, the Second Prospective Study.
References
1 World Health Organization – Ambient (outdoor) air quality and health.
2 U.S. National Park Service – Where Does Air Pollution Come From?
3 Bernice 1 and 2 wells with moisture flare – Evanson Place – Arnegard North Dakota – 2013-07-04. Flickr user Tim Evanson. Reproduced according to a CC BY-SA 2.0 license.
4 U.S. Environmental Protection Agency – Air Emissions Sources.
5 U.S. Environmental Protection Agency – What are Hazardous Air Pollutants?
6 U.S. Environmental Protection Agency – Overview of the Clean Air Act and Air Pollution.
7 U.S. Environmental Protection Agency – The Clean Air Act in a Nutshell: How it Works, March 2013.
8 U.S. Environmental Protection Agency – New Source Performance Standards.
9 U.S. Environmental Protection Agency – Air Emissions Inventories: National Summary of VOC Emissions.
10 Schade, G.W. and Roest, G. (2016). Analysis of non-methane hydrocarbon data from a monitoring station affected by oil and gas development in the Eagle Ford shale, Texas. Elem. Sci. Anth., 4, 96.
11 Texas Commission on Environmental Quality – Air Quality: Eagle Ford Shale Geological Area.
12 U.S. Environmental Protection Agency – Enforcement: Civil Cases and Settlements.
13 U.S. Environmental Protection Agency – Enforcement: Petroleum Refinery National Case Results.
14 U.S. Environmental Protection Agency – Clear Air Act Standards and Guidelines for Petroleum Refineries and Distribution Industry.
15 U.S. Environmental Protection Agency (2011). Toxic Release Inventory (TRI) Program: Lifting of Administrative Stay for Hydrogen Sulfide.
16 U.S. Environmental Protection Agency – AP 42: Compilation of Air Emission Factors, Fifth Edition, Volume 1, Chapter 5: Petroleum Industry.
17 U.S. Environmental Protection Agency – Reducing Emissions of Hazardous Air Pollutants.
18 “Oil Refiners to Reduce Air Pollution at Six Refineries Under Settlement with EPA and Department of Justice.” U.S. Department of Justice Press Release, July 18, 2016.
19 U.S. Environmental Protection Agency (2010). Available and emerging technologies for reducing greenhouse gas emissions from the petroleum refining industry.
20 Bay Area Air Quality Management District (2015). Petroleum Refinery Emissions Reduction Strategy: Workshop Report, September 2015.
21 Sage Environmental Consulting for the American Fuel and Petrochemical Manufacturers (2015). Historical Air Emissions from United States Petroleum Refineries.
22 Texas Commission on Environmental Quality (2016). APWL [Air Pollution Watch List] Proposed Change Document: Delisting – Benzene, Galena Park, TX.
23 File:Houston Ship Channel Galena. U.S. Army Corps of Engineers. Accessed via Wikimedia Commons. Public Domain.
24 U.S. Environmental Protection Agency – Air Quality – National Summary.
25 U.S. Environmental Protection Agency (2017). AirTrends Annual Report: Unhealthy Air Quality Days Trending Down.
26 “EPA Takes Final Step in Phaseout of Leaded Gasoline.” U.S. Environmental Protection Agency Press Release, January 29, 1996.
27 U.S. Federal Aviation Administration – About Aviation Gasoline.
28 U.S. Environmental Protection Agency – Lead Trends.
29 U.S. Environmental Protection Agency – Table of Historical Sulfur Dioxide National Ambient Air Quality Standards (NAAQS).
30 U.S. Environmental Protection Agency – Acid Rain Program: Overview.
31 U.S. Environmental Protection Agency (2017). AirTrends Annual Report: Air Quality Improves as America Grows.
32 U.S. Environmental Protection Agency – Table of Historical Particulate Matter (PM) National Ambient Air Quality Standards.
33 U.S. Environmental Protection Agency – Table of Historical Ozone National Ambient Air Quality Standards.
34 U.S. Environmental Protection Agency – Air Pollutant Emissions Trends Data.
35 U.S. Environmental Protection Agency – Regulations to Reduce Mobile Source Pollution.
36 U.S. Environmental Protection Agency – Ambient Concentrations of Benzene.
37 HDR: Los Angeles Skyline. Flickr user Al Pavangkanan. Reproduced according to a CC BY 2.0 license.
38 U.S. Environmental Protection Agency – Air Pollution: Current and Future Challenges.
39 U.S. Environmental Protection Agency – Benefits and Costs of the Clean Air Act 1990-2020, the Second Prospective Study.
Petroleum and the Environment
Download a full PDF of Petroleum and the Environment (free) or purchase a printed version ($19.99).
Other parts in this series:
1. Petroleum and the Environment: an Introduction
2. Water in the Oil and Gas Industry
3. Induced Seismicity from Oil and Gas Operations
4. Water Sources for Hydraulic Fracturing
5. Using Produced Water
6. Groundwater Protection in Oil and Gas Production
7. Abandoned Wells
8. What Determines the Location of a Well?
9. Land Use in the Oil and Gas Industry
10. The Pinedale Gas Field, Wyoming
11. Heavy Oil
12. Oil and Gas in the U.S. Arctic
13. Offshore Oil and Gas
14. Spills in Oil and Natural Gas Fields
15. Transportation of Oil, Gas, and Refined Products
16. Oil Refining and Gas Processing
17. Non-Fuel Products of Oil and Gas
18. Air Quality Impacts of Oil and Gas
19. Methane Emissions in the Oil and Gas Industry
20. Mitigating and Regulating Methane Emissions
21. Regulation of Oil and Gas Operations
22. Health and Safety in Oil and Gas Extraction
23. Subsurface Data in the Oil and Gas Industry
24. Geoscientists in Petroleum and the Environment
Glossary of Terms
References


