Slide Archive
Below are the charts documenting all of the data collected during the sequence of projects used to craft the vision and Change in the Geosciences report. The raw data is not available publicly because it includes identifying information. All questions asked in surveys are represented in the provided charts.
Each chart is available as a powerpoint slide for download and may be used per the CC-BY-NC-ND license.
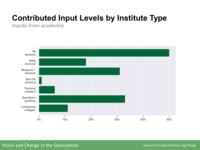
Figure 2-1: Contributed Input Levels by Institute Type
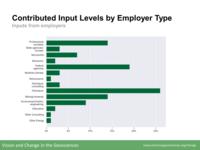
Figure 2-2: Contributed Input Levels by Employer Type
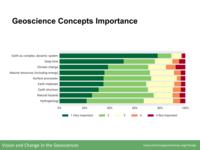
Figure 3-1: Geoscience Concepts Importance
Figure 3-2: Science Skills Importance
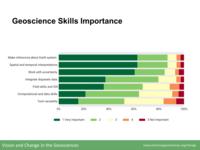
Figure 3-3: Geoscience Skills Importance
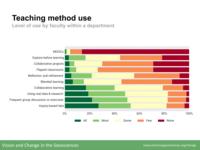
Figure 5-1: Teaching Method Use
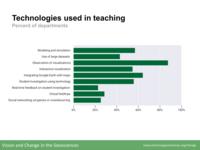
Figure 5-2: Technologies Used in Teaching
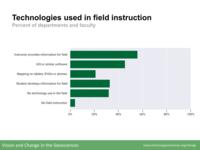
Figure 5-3: Technologies Used in Field Instruction
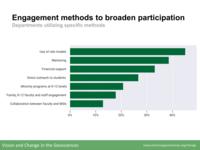
Figure 8-1: Engagement Methods to Broaden Participation
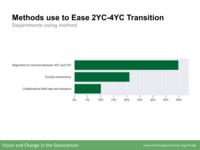
Figure 8-2: Methods Use to Ease 2YC-4YC Transition
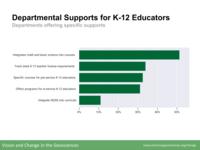
Figure 9-1: Departmental Supports for K-12 Educators
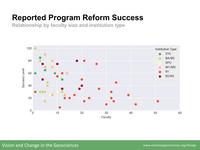
Figure C-1: Reported Program Reform Success
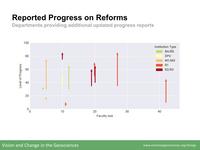
Figure C-2: Reported Profess on Reforms
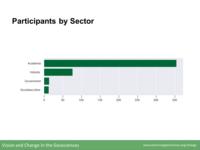
Figure A-1: Participants by Sector
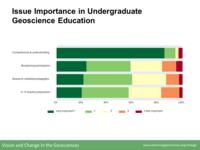
Figure A-2: Issue Importance in Undergraduate Geoscience Education
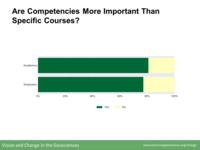
Figure A-3: Are Competencies More Important Than Specific Courses?
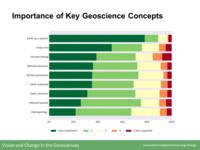
Figure A-4: Importance of Key Geoscience Concepts
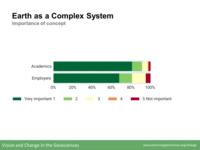
Figure A-5: Earth as a Complex System
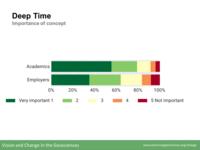
Figure A-6: Deep Time
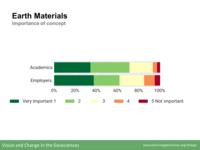
Figure A-7: Earth Materials
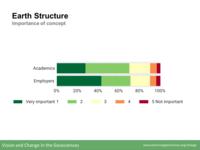
Figure A-8: Earth Structure
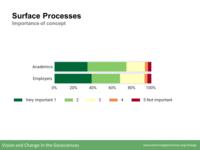
Figure A-9: Surface Processes
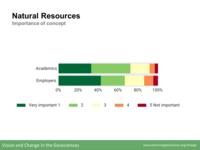
Figure A-10: Natural Resources
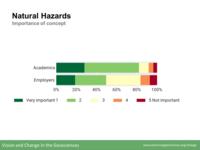
Figure A-11: Natural Hazards
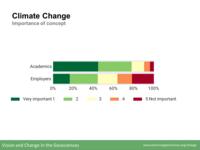
Figure A-12: Climate Change
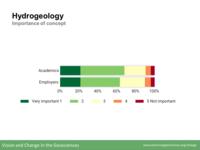
Figure A-13: Hydrogeology
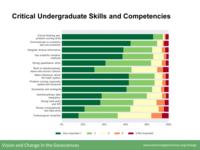
Figure A-14: Critical Undergraduate Skills and Competencies
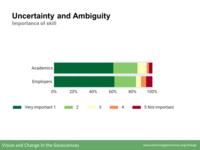
Figure A-15: Uncertainty and Ambiguity
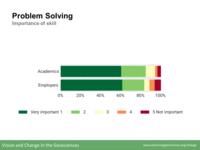
Figure A-16: Problem Solving
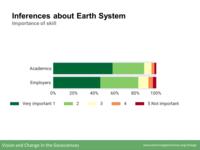
Figure A-17: Inferences about Earth System
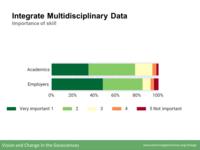
Figure A-18: Integrate Multidisciplinary Data
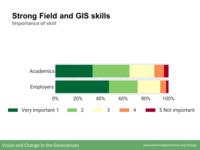
Figure A-19: Strong Field and GIS skills
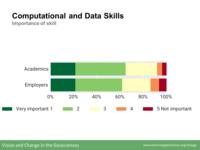
Figure A-20: Computational and Data Skills
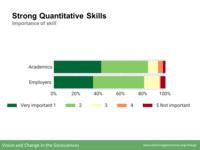
Figure A-21: Strong Quantitative Skills
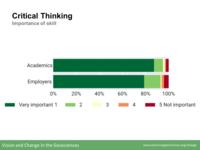
Figure A-22: Critical Thinking
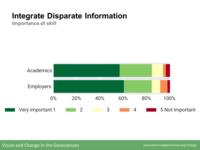
Figure A-23: Integrate Disparate Information
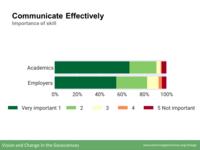
Figure A-24: Communicate Effectively
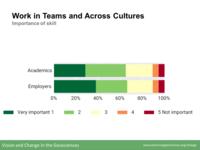
Figure A-25: Work in Teams and Across Cultures
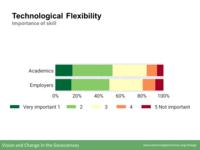
Figure A-26: Technological Flexibility
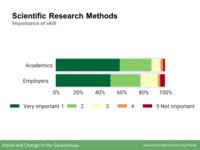
Figure A-27: Scientific Research Methods
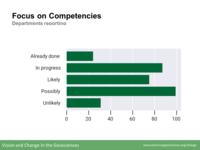
Figure A-28: Focus on Competencies
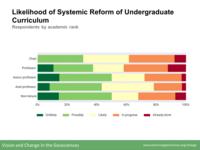
Figure A-29: Likelihood of Systemic Reform of Undergraduate Curriculum
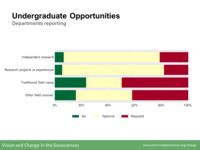
Figure A-30: Undergraduate Opportunities
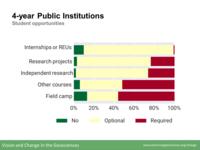
Figure A-31: 4-year Public Institutions
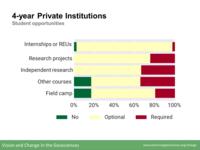
Figure A-32: 4-year Private Institutions
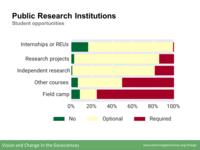
Figure A-33: Public Research Institutions
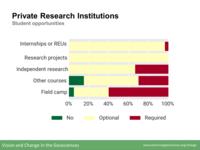
Figure A-34: Private Research Institutions
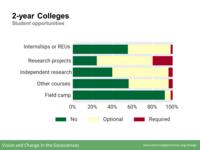
Figure A-35: 2-year Colleges
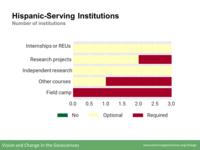
Figure A-36: Hispanic-Serving Institutions
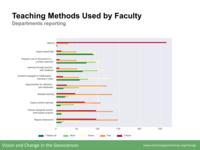
Figure A-37: Teaching Methods Used by Faculty
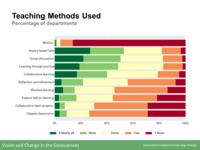
Figure A-38: Teaching Methods Used
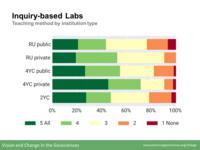
Figure A-39: Inquiry-based Labs
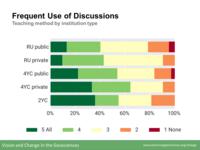
Figure A-40: Frequent Use of Discussions
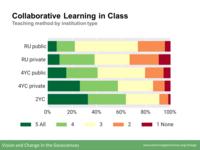
Figure A-41: Collaborative Learning in Class
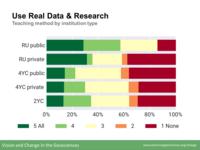
Figure A-42: Use Real Data & Research
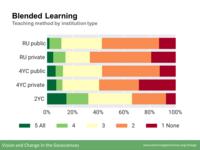
Figure A-43: Blended Learning
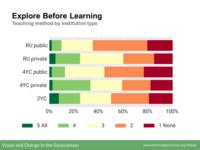
Figure A-44: Explore Before Learning
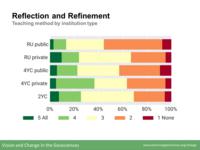
Figure A-45: Reflection and Refinement
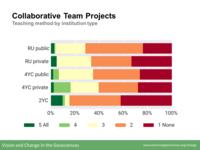
Figure A-46: Collaborative Team Projects
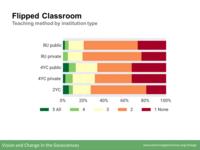
Figure A-47: Flipped Classroom
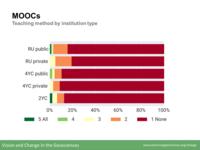
Figure A-48: MOOCs
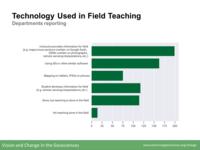
Figure A-49: Technology Used in Field Teaching
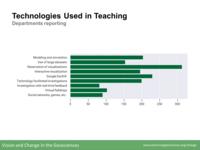
Figure A-50: Technologies Used in Teaching
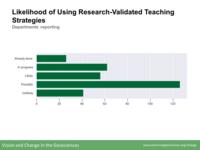
Figure A-51: Likelihood of Using Research-Validated Teaching Strategies
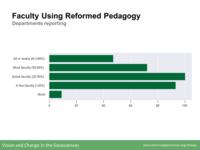
Figure A-52: Faculty Using Reformed Pedagogy
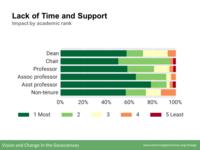
Figure A-53: Lack of Time and Support
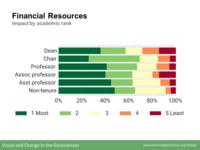
Figure A-54: Financial Resources
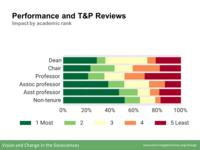
Figure A-55: Performance and T&P Reviews
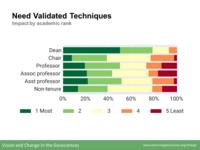
Figure A-56: Need Validated Techniques
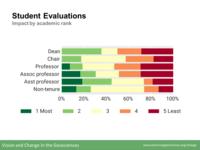
Figure A-57: Student Evaluations
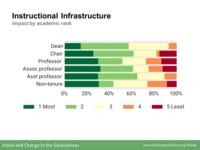
Figure A-58: Instructional Infrastructure
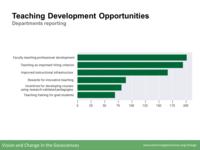
Figure A-59: Teaching Development Opportunities
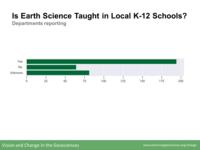
Figure A-60: Is Earth Science Taught in Local K-12 Schools?
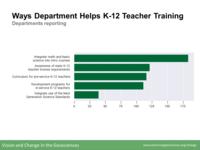
Figure A-61: Ways Department Helps K-12 Teacher Training
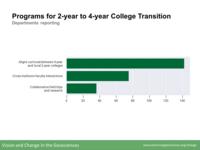
Figure A-62: Programs for 2-year to 4-year College Transition
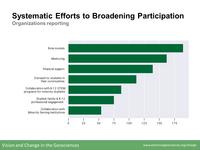
Figure A-63: Systematic Efforts to Broadening Participation
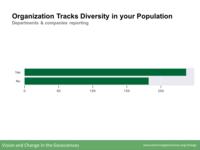
Figure A-64: Organization Tracks Diversity in your Population